3 key sections for your financial model template
A strong 3 statement financial model template Excel requires structure to ensure interconnectedness and accurate forecasting.
A generic, blank spreadsheet with a few rows and columns won't build a robust 3 statement financial model template Excel. You need structure that forces specific inputs and ensures the interconnectedness of your Income Statement, Balance Sheet, and Cash Flow Statement is maintained. This is especially true when you're trying to forecast beyond the next quarter; the assumptions you make early on cascade through everything.
The goal of a 3 statement financial model is to project a company's financial performance and position based on a set of underlying assumptions. This means creating a system where changes in revenue or cost assumptions automatically update your financial statements. Without this automation, you're essentially doing manual calculations for every scenario, which is time-consuming and prone to errors. This is why a well-designed 3 statement financial model template Excel is so valuable.
Understanding the Core Statements
Your financial model will revolve around three primary financial statements:
- 01Income Statement (Profit & Loss): This shows your company's revenues, expenses, and profit over a specific period. Key line items include revenue, cost of goods sold (COGS), gross profit, operating expenses (like salaries, rent, marketing), operating income, interest expense, taxes, and net income.
- 02Balance Sheet: This presents a snapshot of your company's assets, liabilities, and equity at a specific point in time. The fundamental accounting equation, Assets = Liabilities + Equity, must always balance. Assets include cash, accounts receivable, inventory, and fixed assets. Liabilities include accounts payable, debt, and deferred revenue. Equity represents owner's contributions and retained earnings.
- 03Cash Flow Statement: This tracks the movement of cash into and out of your business over a period. It's broken down into three sections:
- Operating Activities: Cash generated or used from normal business operations (e.g., sales, paying suppliers).
- Investing Activities: Cash used for or generated from the purchase or sale of long-term assets (e.g., equipment, property).
- Financing Activities: Cash raised from or paid to debt holders and equity investors (e.g., issuing stock, paying dividends, taking out loans).
The magic of a 3 statement financial model lies in how these statements are linked. Net income from the Income Statement flows into Retained Earnings on the Balance Sheet. Changes in Balance Sheet accounts (like accounts receivable or inventory) impact the Operating Activities section of the Cash Flow Statement.
Building Your Model: Key Sections
A functional 3 statement financial model template Excel typically includes several distinct sections:
Assumptions Tab
This is the brain of your model. All your key drivers and forecasts should live here. This includes:
- Revenue Growth Rate: Percentage increase in revenue year-over-year or month-over-month.
- Cost of Goods Sold (COGS) as a Percentage of Revenue: How much it costs to produce your goods or services.
- Operating Expense Growth: How much line items like salaries, rent, or marketing are expected to increase.
- Tax Rate: Your projected corporate tax rate.
- Capital Expenditures (CapEx): Investments in long-term assets.
- Debt and Equity Financing: Assumptions about future borrowing or stock issuance.
- Working Capital Assumptions: Days sales outstanding (DSO), days inventory outstanding (DIO), and days payables outstanding (DPO).
Example: In your Assumptions tab, you might have a cell for "Annual Revenue Growth Rate" set to 15%. This 15% would then be used in your revenue projection calculation on the Income Statement.
Income Statement Projections
This section uses your assumptions to forecast profitability.
- Revenue: Often calculated as prior period revenue multiplied by (1 + Revenue Growth Rate).
- COGS: Calculated as a percentage of revenue, or based on unit sales and per-unit costs.
- Gross Profit: Revenue - COGS.
- Operating Expenses: Forecasted based on growth rates or as a percentage of revenue.
- Depreciation & Amortization: Often calculated based on a percentage of fixed assets or CapEx. This is a non-cash expense.
- Interest Expense: Based on outstanding debt balances and interest rates.
- Income Before Taxes: Operating Income - Interest Expense.
- Taxes: Income Before Taxes multiplied by the Tax Rate.
- Net Income: Income Before Taxes - Taxes.
Balance Sheet Projections
This statement must always balance.
- Assets:
- Cash: This is a plug figure, typically derived from the Cash Flow Statement.
- Accounts Receivable: Often calculated based on Days Sales Outstanding (DSO) and projected revenue.
- Inventory: Calculated based on Days Inventory Outstanding (DIO) and projected COGS.
- Fixed Assets (PP&E): Beginning balance + CapEx - Depreciation.
- Liabilities:
- Accounts Payable: Calculated based on Days Payables Outstanding (DPO) and projected COGS or operating expenses.
- Debt: Beginning balance + New Debt - Debt Repayments.
- Deferred Revenue: If you collect cash upfront for services not yet rendered.
- Equity:
- Common Stock/Paid-in Capital: Often remains static unless new equity is issued.
- Retained Earnings: Beginning Retained Earnings + Net Income - Dividends Paid.
Balancing Check: A common practice is to have a separate cell that calculates "Assets - Liabilities - Equity". This cell should always equal zero. If it doesn't, there's an error in your model.
Cash Flow Statement Projections
This statement reconciles Net Income to the change in cash. It typically uses the indirect method, which starts with Net Income.
- Cash Flow from Operations:
- Start with Net Income.
- Add back non-cash expenses like Depreciation & Amortization.
- Adjust for changes in working capital accounts (Accounts Receivable, Inventory, Accounts Payable, Deferred Revenue, etc.). An increase in an asset account (like AR or Inventory) is a cash outflow (subtract), while an increase in a liability account (like AP) is a cash inflow (add).
- Cash Flow from Investing:
- Typically includes Capital Expenditures (a cash outflow).
- Cash Flow from Financing:
- Includes changes in Debt and Equity, and Dividend Payments (a cash outflow).
- Net Change in Cash: Sum of the three sections.
- Ending Cash Balance: Beginning Cash Balance + Net Change in Cash. This figure must match the Cash line item on your projected Balance Sheet.
Using a 3 Statement Financial Model Template Excel
When you're looking for a 3 statement financial model template Excel, you want one that's already structured to enforce these relationships. You should be able to input your assumptions, and the rest of the model should populate automatically. This is precisely what a well-built template provides.
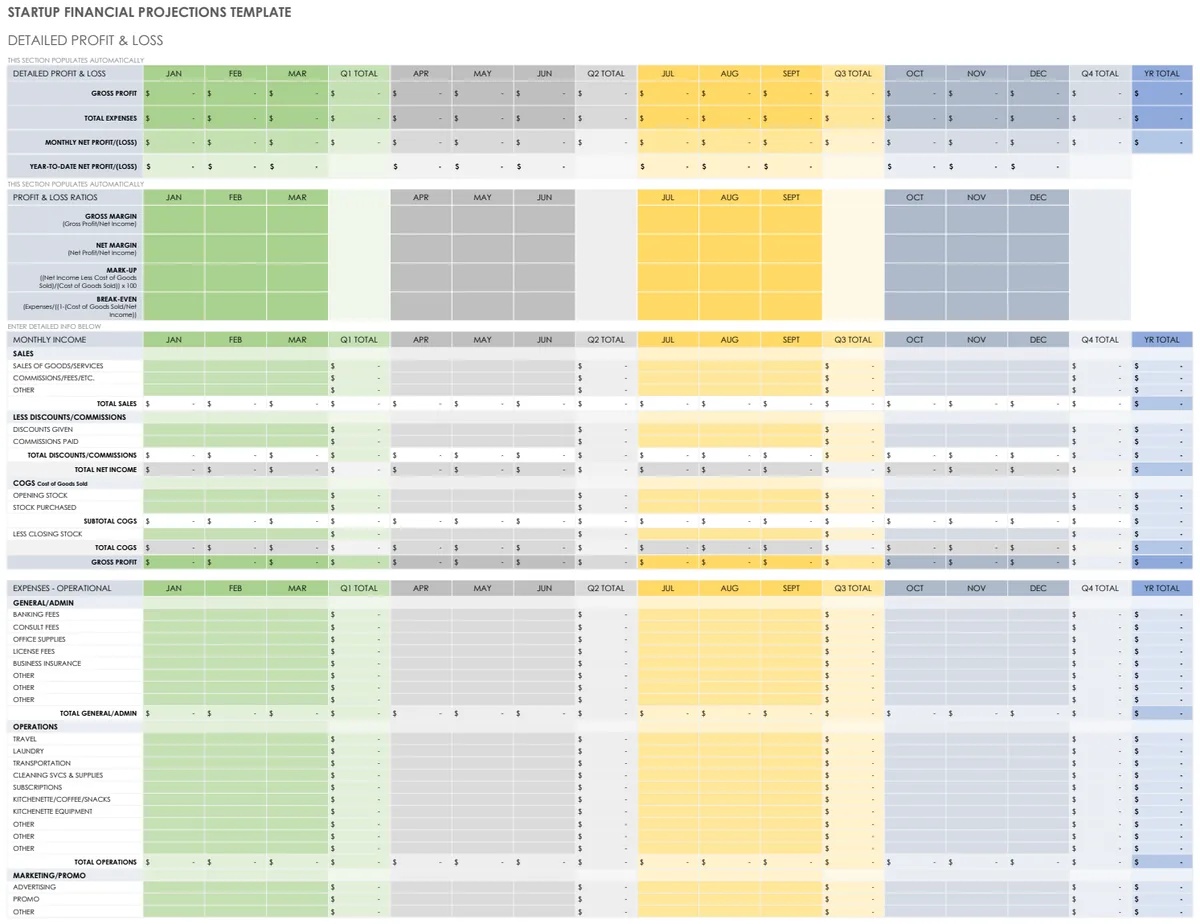
For startups, especially, a template can be invaluable. It helps you model out your first few years of operation, understand funding needs, and forecast profitability. The Startup Financial Projections Template is designed to handle these dynamic forecasts, integrating P&L, Balance Sheet, and Cash Flow automatically.
Key Formulas to Master
While a template provides the structure, understanding the underlying formulas is crucial for customization and troubleshooting.
- SUMIFS/SUMPRODUCT: Useful for summing values based on multiple criteria, especially for tracking expenses or revenue by category over time.
- XLOOKUP (or VLOOKUP/INDEX-MATCH): Essential for pulling data from your Assumptions tab into the financial statements.
- IF Statements: Used for conditional logic, such as applying different tax rates or growth rates based on certain thresholds.
- Simple Arithmetic: Basic addition, subtraction, multiplication, and division form the backbone of most calculations.
- Date Functions: If you're building a monthly or quarterly model, functions like
EOMONTHorDATEare helpful for managing time periods.
Common Mistakes to Avoid
Building a financial model is an iterative process, and errors are common. Watch out for these pitfalls:
- Circular References: These occur when a formula in one cell depends on another cell, which in turn depends back on the first cell. Excel will flag these, but they can be tricky to resolve. A common circular reference involves Net Income and Retained Earnings.
- Incorrect Linking: Failing to properly link Net Income to Retained Earnings, or Net Change in Cash to the Balance Sheet Cash account. This is the most common reason a Balance Sheet won't balance.
- Assumption Errors: Entering incorrect growth rates, percentages, or initial balances in your Assumptions tab.
- Not Accounting for Non-Cash Items: Forgetting to add back Depreciation & Amortization when calculating Cash Flow from Operations.
- Ignoring Working Capital: Not modeling changes in Accounts Receivable, Inventory, and Accounts Payable, which can significantly impact cash flow.
- Overly Complex Models: While detail is good, sometimes a model can become so complex that it's impossible to audit or understand. Stick to the essential drivers.
Customizing Your Template
Once you have a solid 3 statement financial model template Excel, you'll likely need to customize it to your specific business.
Adding New Line Items
If your Income Statement or Balance Sheet has accounts not included in the template, you'll need to insert new rows. Be sure to:
- 01Insert the row in the correct statement (Income Statement, Balance Sheet, or Cash Flow).
- 02Link the new line item to the appropriate assumption in your Assumptions tab. For example, if you add a "Consulting Fees" expense, create an assumption for its growth rate or its relation to revenue and link it.
- 03Ensure that the new line item is correctly incorporated into subtotals and totals.
- 04Crucially, check if the new line item affects any working capital accounts or other Balance Sheet items that feed into the Cash Flow Statement.
Adjusting Calculation Logic
Sometimes, the pre-built logic in a template doesn't precisely match your business. For instance, your COGS might not be a simple percentage of revenue but tied to specific units sold.
- Identify the formula: Locate the existing formula for the line item you need to adjust.
- Modify the formula: Replace the existing logic with your new calculation. For example, change
=Revenue * 0.4to=[Units Sold] * [Cost Per Unit]. - Verify data sources: Ensure that the new inputs (like "Units Sold" or "Cost Per Unit") are either assumptions you've added or are themselves derived correctly elsewhere in the model.
- Test thoroughly: Recalculate your financial statements to ensure the change hasn't broken other parts of the model.
Scenario Analysis
A key benefit of a dynamic model is its ability to perform scenario analysis. You can create different versions of your Assumptions tab (e.g., "Base Case," "Optimistic Case," "Pessimistic Case") by copying the tab and changing the assumption values. Then, you can use data validation or simple dropdowns to select which scenario's assumptions are actively driving your financial statements. This helps you understand the potential range of outcomes for your business. For advanced scenario planning and sensitivity analysis, consider templates like the Cash Flow Forecasting Model with Direct & Indirect Methods, which allow for detailed exploration of different financial futures.
Frequently Asked Questions
How often should I update my financial model?
You should update your financial model at least quarterly, or whenever there are significant changes to your business operations or market conditions. Regularly comparing your projections to actual results helps you refine your assumptions and improve future forecasts.
What is the difference between a 3 statement model and a DCF model?
A 3 statement financial model projects the Income Statement, Balance Sheet, and Cash Flow Statement for a set period, typically 3-5 years. A Discounted Cash Flow (DCF) model uses the projected free cash flows from a 3 statement model to estimate the intrinsic value of a business. The 3 statement model is the foundation upon which a DCF is built.
Can I use a 3 statement financial model for fundraising?
Absolutely. A well-constructed 3 statement financial model is a critical document for potential investors. It demonstrates your understanding of the business drivers, shows projected financial performance, and helps investors assess the viability and potential return on their investment. For a comprehensive tool to present your financial story, the Business Financial Statement Template can also be very useful for reporting historical performance alongside projections.
Where can I find pre-built templates?
Many resources offer templates, both free and paid. For a robust and reliable 3 statement financial model template Excel, consider specialized libraries designed for business professionals. The OpenWorksheet library offers a range of templates, including financial projection tools, often available for a one-time fee that grants access to all downloads.