Free Excel project dashboard: Build yours fast
Learn how to build a dynamic project dashboard in Excel for free, tracking progress and identifying risks quickly.
The TODAY() function, often overlooked, is critical for any project dashboard template Excel free. Without it, your "days remaining" calculations will stagnate, showing an ever-increasing delta against deadlines that are actually approaching. You need a dynamic system, one that accurately reflects the current date to calculate progress, budget burn rate, and schedule adherence.
A well-structured project dashboard template Excel free can transform raw project data into actionable insights. It’s not just about pretty charts; it's about quickly identifying risks, understanding resource allocation, and communicating status to stakeholders. This means designing your dashboard with a clear purpose: what questions does it need to answer, and for whom?
Core Components of an Effective Project Dashboard
At its heart, a project dashboard consolidates information from various sources into a single, easy-to-understand view. For project management, this typically includes several key areas:
- Project Overview: High-level status, overall health (e.g., green, yellow, red), key milestones, and project manager.
- Schedule Tracking: Planned vs. actual start and end dates, percentage complete, days remaining.
- Budget Management: Total budget, spent to date, remaining budget, burn rate.
- Task Management: Number of tasks completed, in progress, and overdue.
- Resource Allocation: Who is assigned to what, and their current workload.
- Risk & Issue Tracking: Open risks, critical issues, and their impact.
When you're searching for a project dashboard template Excel free, look for one that has these foundational elements, or can be easily customized to include them. The best templates provide pre-built charts and tables that automatically update as you input new data.
Structuring Your Data for the Dashboard
The effectiveness of any dashboard hinges on the quality and organization of the underlying data. Before even thinking about charts, focus on your data structure. You'll likely need at least three primary sheets:
- 01Projects List: A master list of all your projects. Columns might include:
Project ID,Project Name,Project Manager,Start Date,End Date,Budget,Status(e.g., Planning, In Progress, Completed, On Hold). - 02Tasks/Activities: Detailed breakdown of work within each project. Columns:
Task ID,Project ID,Task Name,Assigned To,Start Date,Due Date,Actual End Date,Status(e.g., Not Started, In Progress, Complete, Blocked),Percentage Complete. - 03Expenses/Budget Tracking: Records of costs incurred. Columns:
Expense ID,Project ID,Date,Category(e.g., Labor, Materials, Travel),Amount.
This structured approach allows you to use powerful Excel functions like SUMIFS, AVERAGEIFS, and COUNTIFS to aggregate data for your dashboard. For example, to calculate the total spent for a specific project, you might use =SUMIFS(Expenses!E:E, Expenses!B:B, A2) where A2 contains the Project ID on your dashboard sheet.
Building Your Dashboard: A Walkthrough
Let's walk through creating a simple project dashboard. Assume you have your data organized in the three sheets mentioned above.
- 01Create a New Sheet: Name it "Dashboard".
- 02Set Up Project Summary Area: In cells
A1:B3, add labels like "Total Projects:", "Projects In Progress:", "Projects Overdue:". - 03Add Formulas for Summary:
- Total Projects:
=COUNTA('Projects List'!B:B)-1(subtracting 1 for the header row). - Projects In Progress:
=COUNTIFS('Projects List'!E:E, "In Progress")(assuming "In Progress" is a status in your 'Projects List' sheet). - Projects Overdue: This is more complex. You need to compare the
End Datefrom the 'Projects List' sheet withTODAY()and theStatus. A formula could look like:=SUM(IF('Projects List'!E:E="In Progress", IF('Projects List'!C:C<TODAY(), 1, 0))). This is an array formula and might require pressing Ctrl+Shift+Enter in older Excel versions.
- 04Create a Project-Specific View: Below the summary, you might want to select a specific project to see its details. Add a dropdown for
Project Name(using Data Validation) in cellD2. - 05Use `XLOOKUP` for Details: In cells
D4downwards, you can pull key information for the selected project. For example, to get theBudget:=XLOOKUP(D2, 'Projects List'!B:B, 'Projects List'!F:F, "Not Found"). You'd do similar lookups forProject Manager,Start Date,End Date, andStatus. - 06Visualize Schedule and Budget:
- Schedule: Create a simple bar chart showing
Start Datevs.End Datefor the selected project. You might need to format these dates as numbers and calculate the duration. - Budget: A simple gauge chart or a column chart showing
Budgetvs.Spent(calculated usingSUMIFSon the Expenses sheet) is effective.
- 07Add Task Status Overview: Use
COUNTIFSto tally tasks by status for the selected project. For example, "Complete Tasks:"=COUNTIFS('Tasks/Activities'!B:B, XLOOKUP(D2, 'Projects List'!B:B, 'Projects List'!A:A), 'Tasks/Activities'!H:H, "Complete"). Then, visualize these counts with a pie chart.
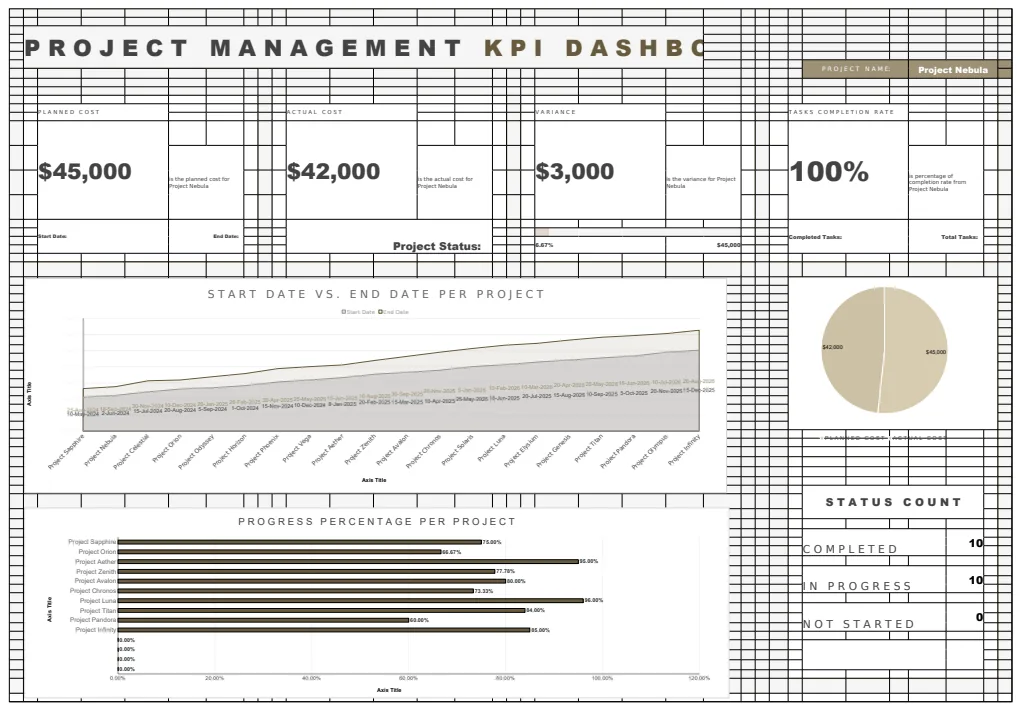
This basic setup provides a foundation. For a more comprehensive solution, you might consider a template like the Project Management KPI Dashboard Template, which offers more sophisticated tracking of cost, schedule, and task completion metrics.
Visualizing Your Data Effectively
Charts are the backbone of any good dashboard. They translate numbers into easily digestible visual information. For project management, common and effective chart types include:
- Gantt Charts: While complex to build from scratch, they are ideal for visualizing project timelines, task dependencies, and progress.
- Progress Bars: Simple visual indicators for task or project completion percentage.
- Pie Charts: Useful for showing proportions, such as budget allocation by category or task status distribution.
- Column/Bar Charts: Excellent for comparing values, like budget vs. actual spend, or tasks completed per team member.
- Line Charts: Good for tracking trends over time, such as cumulative budget spend or project completion rate.
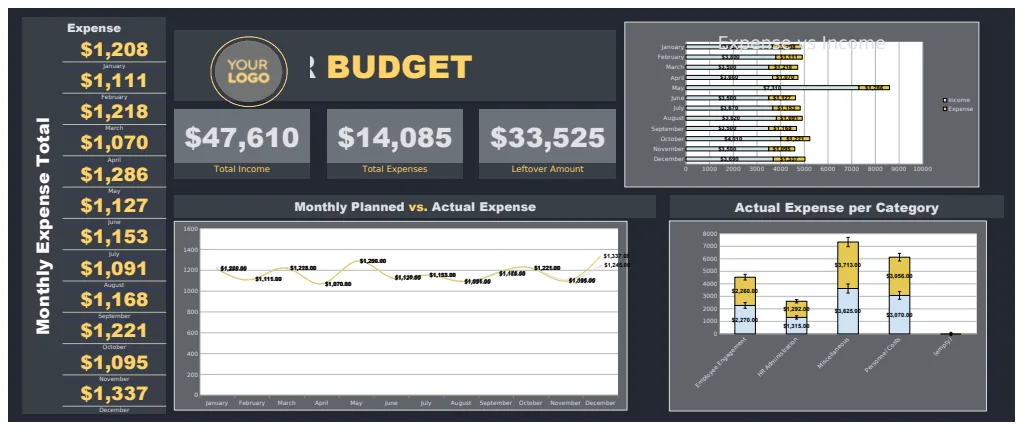
When selecting or building a project dashboard template Excel free, pay attention to the clarity and relevance of the visualizations. Are they easy to understand at a glance? Do they highlight the most critical information? A Project Dashboard Template should offer clear visuals for expenses, budgets, and remaining funds.
Common Pitfalls to Avoid
Even with a great template, users often make mistakes that undermine their dashboard's usefulness. Be mindful of these:
- Over-Complication: Trying to display too much information on one screen. A dashboard should be focused. If it takes more than a minute to grasp the key takeaways, it’s too busy.
- Stale Data: Forgetting to update the source data sheets regularly. This is where the
TODAY()function is crucial for dynamic calculations, but it can't fix manual data entry lapses. - Incorrect Formulas: Typos in cell references, incorrect function arguments, or using the wrong aggregation method (
SUMvs.AVERAGE). Always double-check your formulas, especially when they involve ranges across multiple sheets. - Poor Data Structure: Inputting data haphazardly without consistent columns or formats. This makes formula writing and data aggregation extremely difficult.
- Ignoring Thresholds: Not defining clear "red flag" thresholds for your KPIs. A RAG status (Red, Amber, Green) is only useful if you know precisely what conditions trigger each color.
Advanced Features and Customization
While many free templates provide a solid starting point, you might need to customize them to fit your specific needs. Consider these advanced features:
- Conditional Formatting: This is your best friend for highlighting critical data. Set rules to automatically color-code cells based on values. For example, highlight project end dates in red if they are past due, or turn a budget cell red if spending exceeds 90% of the total.
- Data Validation: Use this to create dropdown lists for consistent data entry (e.g., for
Statusfields). This reduces errors and speeds up data input. - Macros/VBA: For highly repetitive tasks or complex automated updates, you might consider using VBA. However, this adds complexity and requires programming knowledge. Many users find that advanced Excel formulas are sufficient.
- Slicers and Timelines: If your dashboard uses PivotTables or PivotCharts, Slicers and Timelines offer interactive filtering capabilities, allowing users to quickly drill down into specific projects, time periods, or categories without manually changing filters. A template like the Project Management Dashboard Template often includes these for easy filtering.
Frequently Asked Questions
Can I find a truly comprehensive project dashboard template Excel free that requires no customization?
While many free templates exist, finding one that perfectly matches every project's unique needs without any tweaks is rare. Most require some level of adjustment to column names, status options, or specific metrics. However, starting with a well-designed template like an Excel Project Management Dashboard can save significant setup time.
How do I ensure my dashboard stays up-to-date automatically?
Automatic updates primarily depend on how you input data. Ensure your source sheets are consistently updated. For date-related calculations, using functions like TODAY() is essential. If your data resides in external files or databases, you might explore Excel's "Get & Transform Data" (Power Query) features for more automated data refreshes, though this goes beyond typical free template functionality.
What if I have multiple projects running concurrently?
A good project dashboard template should handle multiple projects. Look for features that allow you to view an aggregated overview (e.g., total projects, overall budget status) and then drill down into individual project details. Many templates offer a summary sheet and then allow you to select specific projects from a dropdown or list. The Project Management KPI Dashboard Template is designed for this multi-project oversight.
Is it better to build from scratch or use a template?
For most users, starting with a template is more efficient. Building a robust dashboard from scratch involves significant design and formula-writing effort. Templates provide a pre-built structure and common visualizations that you can then adapt. The cost for unlimited downloads of our curated templates is a one-time $9 fee, which can be a worthwhile investment for access to professionally designed solutions.