Rental income tracker fails? Fix this common error.
Avoid the common pitfalls of free rental property spreadsheet templates and discover how to track income, expenses, and profitability effectively.
A generic "rental property spreadsheet template free" download often hides more work than it saves, forcing you to cobble together formulas and manually input data that should be automated. You're likely looking for a system that simplifies tracking income, expenses, and profitability, not one that creates a new administrative burden. The key is a template designed with specific real estate investment needs in mind, offering clarity and actionable insights from day one.
This approach means moving beyond simple income and expense logs to a dashboard that can forecast cash flow and highlight potential issues before they impact your bottom line. A well-structured spreadsheet can become your most valuable tool for managing multiple properties, assessing new deals, and ensuring your investments are performing as expected. Let's look at how to build or find a template that truly works for you.
Essential Columns for Rental Property Tracking
When you're managing rental properties, the data you capture is crucial. A robust spreadsheet needs more than just a rent collected column. Think about these key areas:
- Property Identifier: A unique name or address for each property. This is vital if you own more than one.
- Tenant Name: Keeps track of who is currently occupying the unit.
- Lease Start Date & End Date: Essential for managing lease renewals and understanding occupancy periods.
- Monthly Rent Due: The standard rent amount for the period.
- Actual Rent Received: Accounts for partial payments, late payments, or waived fees.
- Late Fees Collected: Tracks any additional income from late rent payments.
- Other Income: Includes fees for pet deposits, parking, or other services.
- Property Management Fees: If you use a property manager, this is a direct expense.
- Mortgage Payment: Principal and interest paid on the loan for the property.
- Property Taxes: Annual taxes, often divided by 12 for monthly tracking.
- Homeowner's Insurance: Annual premiums, also divided by 12.
- HOA Dues: If applicable, for condos or properties within homeowners' associations.
- Utilities Paid by Owner: Gas, electric, water, sewer, trash if you cover these costs.
- Repairs & Maintenance: A critical category. Break this down further if possible (e.g., Plumbing, Electrical, HVAC, General Repairs).
- Capital Expenditures (CapEx): Larger, infrequent expenses like roof replacement or appliance upgrades. These should be tracked separately from routine maintenance.
- Vacancy Loss: The amount of rent lost due to a unit being empty between tenants.
- Advertising Costs: Expenses for listing the property.
- Legal Fees: Costs associated with evictions or lease disputes.
- Bookkeeping/Accounting Fees: If you outsource this work.
- Net Operating Income (NOI): This is a calculated field: (Total Income) - (Operating Expenses).
- Cash Flow: NOI minus mortgage principal payments and CapEx.
Setting Up Your Income and Expense Tracker
To effectively manage your rental portfolio, a structured approach is best. Many find that a dedicated Rental Property Income and Expenses Tracker can automate much of this initial setup. However, if you're building your own, here’s a common and effective layout:
Sheet 1: Property Overview This sheet provides a snapshot of each property. Columns could include: Property Address, Purchase Date, Purchase Price, Loan Amount, Monthly P&I, Estimated Annual Taxes, Estimated Annual Insurance, Current Rent, and a link to a more detailed sheet for that specific property.
Sheet 2: Monthly Transaction Log This is your main data entry sheet. Each row represents a single transaction. Columns here would mirror the essential columns listed above: Date, Property, Transaction Type (Income/Expense), Category (e.g., Rent, Repairs, Taxes), Description, Amount.
Sheet 3: Monthly Summary/Dashboard This sheet pulls data from your transaction log to provide monthly and annual summaries. It should calculate total income, total expenses, NOI, and cash flow for each property and for your entire portfolio. You can use formulas like SUMIFS and AVERAGEIFS here. For example, to calculate total rent income for a specific property in a given month: =SUMIFS('Transaction Log'!E:E, 'Transaction Log'!B:B, "123 Main St", 'Transaction Log'!C:C, "Income", 'Transaction Log'!D:D, "Rent", 'Transaction Log'!A:A, ">=2023-01-01", 'Transaction Log'!A:A, "<=2023-01-31").
Calculating Key Performance Indicators (KPIs)
Beyond just tracking numbers, you need to understand what they mean. Key performance indicators help you gauge the health and profitability of your investments.
- Net Operating Income (NOI): Total rental income minus all operating expenses (excluding mortgage principal and interest, and CapEx). This tells you how profitable the property is before financing.
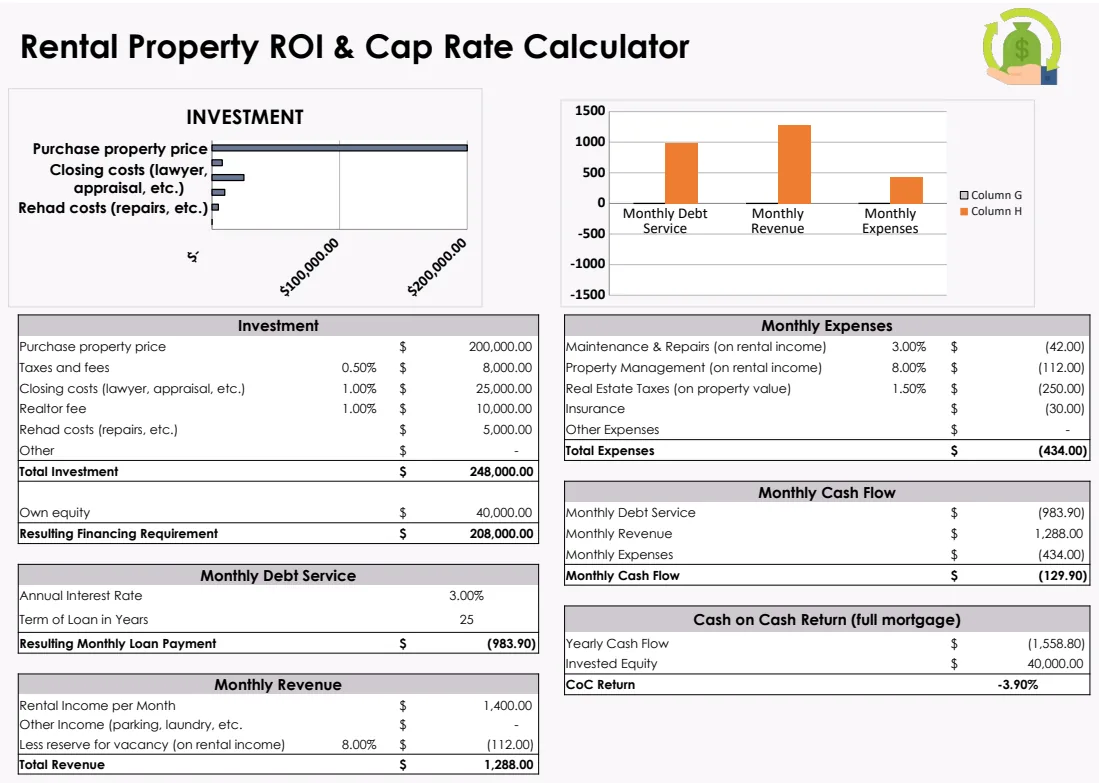
- Capitalization Rate (Cap Rate): NOI divided by the property's market value or purchase price. This is a common metric for comparing the unleveraged returns of different properties. A higher cap rate generally indicates a better return.
- Cash-on-Cash Return: Annual pre-tax cash flow divided by the total cash invested (down payment, closing costs, initial repairs). This shows the return on your actual cash outlay.
- Gross Rent Multiplier (GRM): Property price divided by its annual gross rental income. A lower GRM often suggests a better value, assuming comparable properties.
- Vacancy Rate: (Total Lost Rent / Potential Gross Rent) * 100. This measures how often your units are sitting empty.
You can build these calculations directly into your dashboard sheet. For instance, if your NOI is in cell D10 and your property value is in cell B2, your Cap Rate formula would be =IFERROR(D10/B2, 0). A template like the Rental Property ROI & Cap Rate Calculator can automate these complex calculations for you.
Automating with Formulas and Conditional Formatting
To make your spreadsheet work for you, leverage formulas and conditional formatting.
Formulas:
- `SUMIFS`: Essential for aggregating data based on multiple criteria (e.g., summing expenses for a specific property in a specific month).
- `XLOOKUP` or `VLOOKUP`: Useful for pulling data from one sheet to another, like matching a property address to its owner or purchase price.
- `IFERROR`: Wraps around other formulas to display a blank cell or a custom message (like "N/A") instead of an error like
#DIV/0!when data is missing. - `EDATE`: Helps calculate lease end dates based on a start date and lease term in months.
=EDATE(LeaseStartDate, LeaseTermMonths).
Conditional Formatting:
- Highlight Over-Budget Expenses: Set rules to turn cells red if an expense category exceeds a certain percentage of income, or if a repair cost surpasses a predefined threshold. For example, you might highlight any "Repairs & Maintenance" entry in the "Monthly Transaction Log" that exceeds $500.
- Flag Upcoming Lease Expirations: Format cells in your "Property Overview" sheet to turn yellow if a lease is expiring within the next 60 days, and red if it's within 30 days. This requires a formula like
=AND(LeaseEndDate <= TODAY()+60, LeaseEndDate >= TODAY()). - Visualize Cash Flow: Use color scales to show positive cash flow in green and negative cash flow in red.
Common Mistakes to Avoid
Many users of a free rental property spreadsheet template fall into predictable traps.
- Inconsistent Data Entry: Not categorizing expenses uniformly or entering amounts incorrectly. This makes accurate reporting impossible. Always use dropdown lists for categories if possible.
- Ignoring CapEx: Only tracking routine maintenance and not setting aside funds or tracking major replacements like a new HVAC system. This leads to surprise expenses that derail your cash flow projections.
- Not Tracking Vacancy: Forgetting to account for lost rent when a unit is empty. This significantly inflates your perceived profitability.
- Mixing Personal and Business Finances: Using the same spreadsheet for your personal budget and rental properties. Keep them strictly separate to maintain clarity and simplify tax preparation.
- Over-Reliance on a Free Template: Downloading a template without understanding its structure or limitations. If it doesn't fit your specific needs, it's often more work than it's worth. For complex portfolios, a more specialized tool might be necessary.
When to Consider a More Advanced Solution
While a well-built spreadsheet can be incredibly powerful, there are times when you might outgrow it. If you're managing more than a handful of properties, dealing with complex lease structures, or need to track detailed accounting for multiple entities, the administrative overhead can become significant.
At this point, specialized property management software might be a better fit. However, for many individual investors and small landlords, a robust spreadsheet or a dedicated template from a library like OpenWorksheet offers a cost-effective and highly customizable solution. The initial investment for unlimited access to premium templates is a one-time $9 fee, providing a significant advantage over constantly searching for a suitable rental property spreadsheet template free that might be outdated or incomplete.
Can I Track Multiple Properties in One Spreadsheet?
Yes, absolutely. The key is to include a "Property Identifier" column in your transaction log and use formulas like SUMIFS or pivot tables to filter and aggregate data for each property individually or for your entire portfolio. A dashboard sheet can then summarize performance across all your assets, helping you compare them side-by-side.
How Do I Handle Repairs vs. Capital Expenditures?
This is a common point of confusion. Repairs are typically for fixing something that is broken or for routine upkeep (e.g., fixing a leaky faucet, painting a room between tenants). These are generally considered operating expenses and are tax-deductible in the year they are incurred. Capital Expenditures (CapEx) are for significant improvements or replacements that extend the life of the property or add value (e.g., replacing a roof, installing a new HVAC system, a major renovation). CapEx items are usually depreciated over time rather than expensed all at once. Clearly separating these in your spreadsheet is crucial for accurate accounting and tax reporting.
What if My Tenant Pays Rent Late or Partially?
Your "Actual Rent Received" column should reflect the exact amount paid. If a tenant pays late, you'd record the actual payment date and amount. Any additional charges for late fees should be entered in a separate "Late Fees Collected" income category. This ensures your income records are accurate and you can track payment patterns.
How Do I Use a Spreadsheet for Tax Purposes?
Your spreadsheet should provide a clear breakdown of income and expenses by category. Most of this data can be transferred directly to your tax forms (like Schedule E for rental income in the US). Ensure you are tracking all legitimate business expenses, as these can significantly reduce your taxable income. It's always wise to consult with a tax professional to ensure you're taking advantage of all eligible deductions and reporting correctly.