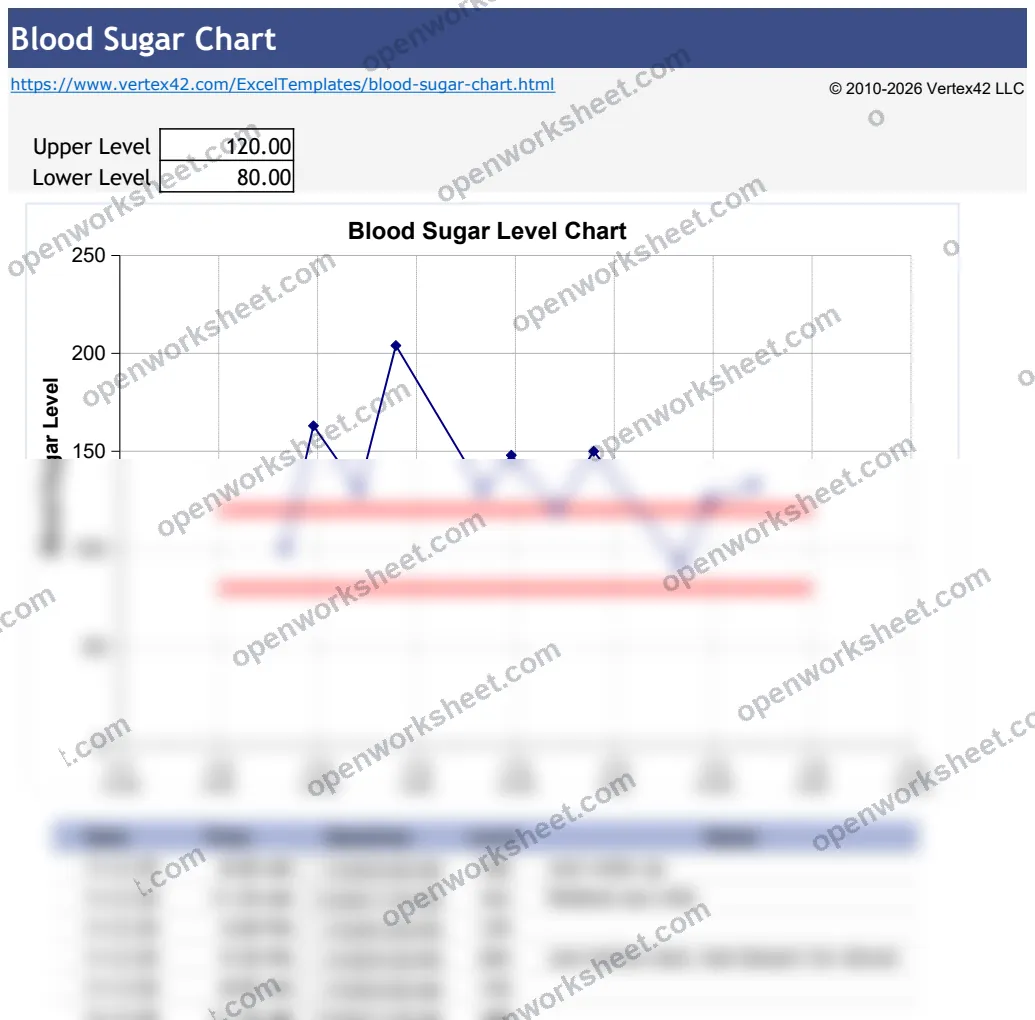
Blood Sugar Chart
Track daily blood sugar levels and A1C results to monitor diabetes management and health trends.
This template helps you log and visualize blood sugar readings over time, including A1C level benchmarks for comprehensive diabetes tracking. It's designed for individuals managing diabetes or prediabetes who need clear visibility into their glucose patterns and how they correlate with treatment effectiveness.
The chart displays upper and lower level thresholds, making it easy to identify readings outside your target range. Built-in formulas automatically calculate trends and reference A1C targets, helping you share data with healthcare providers and make informed lifestyle decisions.
What's inside
- Blood sugar level logging with date tracking
- A1C level benchmark chart
- Upper and lower threshold indicators
- Automatic calculation of trends
- Visual charts for pattern recognition
Download this and everything else
.xlsx · 3 sheets · includes charts
$29$9once for thousands of templates. No subscription.
- Limited-time offer, normally $29
- One payment, no subscription
- 14-day refund
More in Health & Wellness
 Health & Wellness
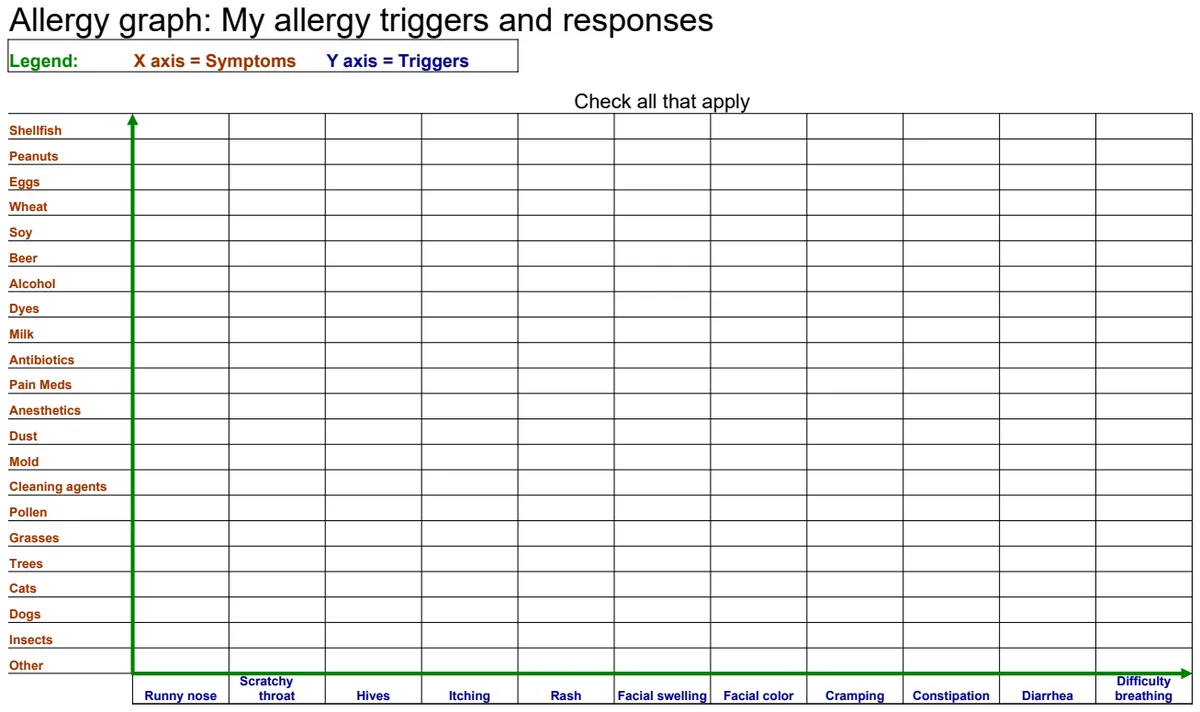
Allergy Trigger & Response Graph
Map your allergy triggers against symptoms to identify patterns and manage reactions effectively.
- Trigger-symptom cross-reference grid
- Visual pattern identification
- Customizable trigger and symptom categories
 Health & Wellness
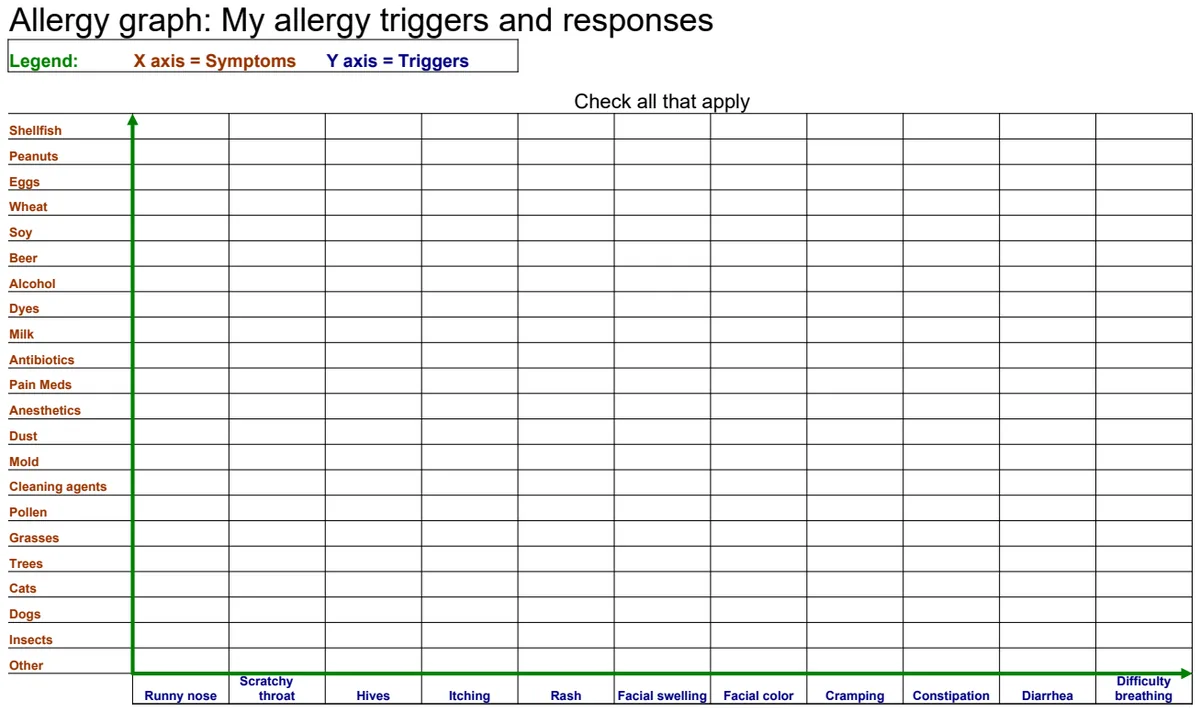
Allergy Triggers and Responses Chart
Track and visualize your allergy triggers against symptoms in an easy-to-read grid format.
- Trigger vs. symptom grid with checkboxes
- Visual cross-reference chart
- Legend for easy interpretation
 Health & Wellness
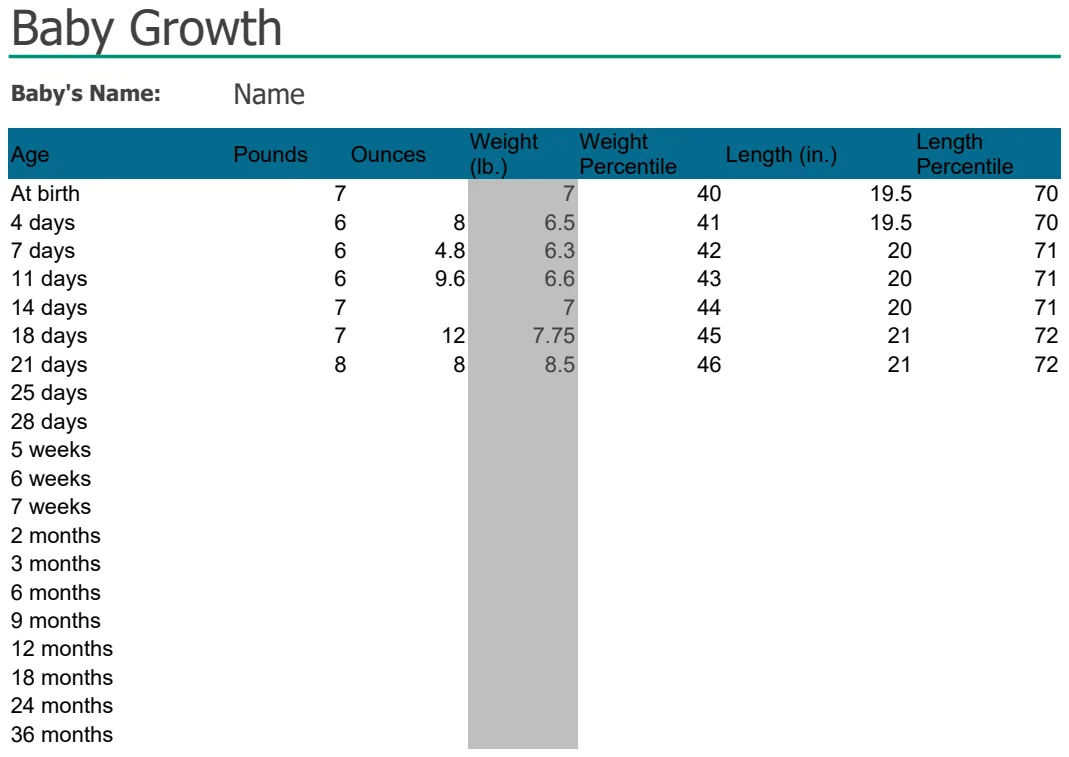
Baby Growth Chart Tracker
Monitor your baby's weight and growth percentiles over time with visual charts and tracking data.
- Weight entry in pounds and ounces
- Automatic weight calculation
- Growth percentile tracking
 Health & Wellness
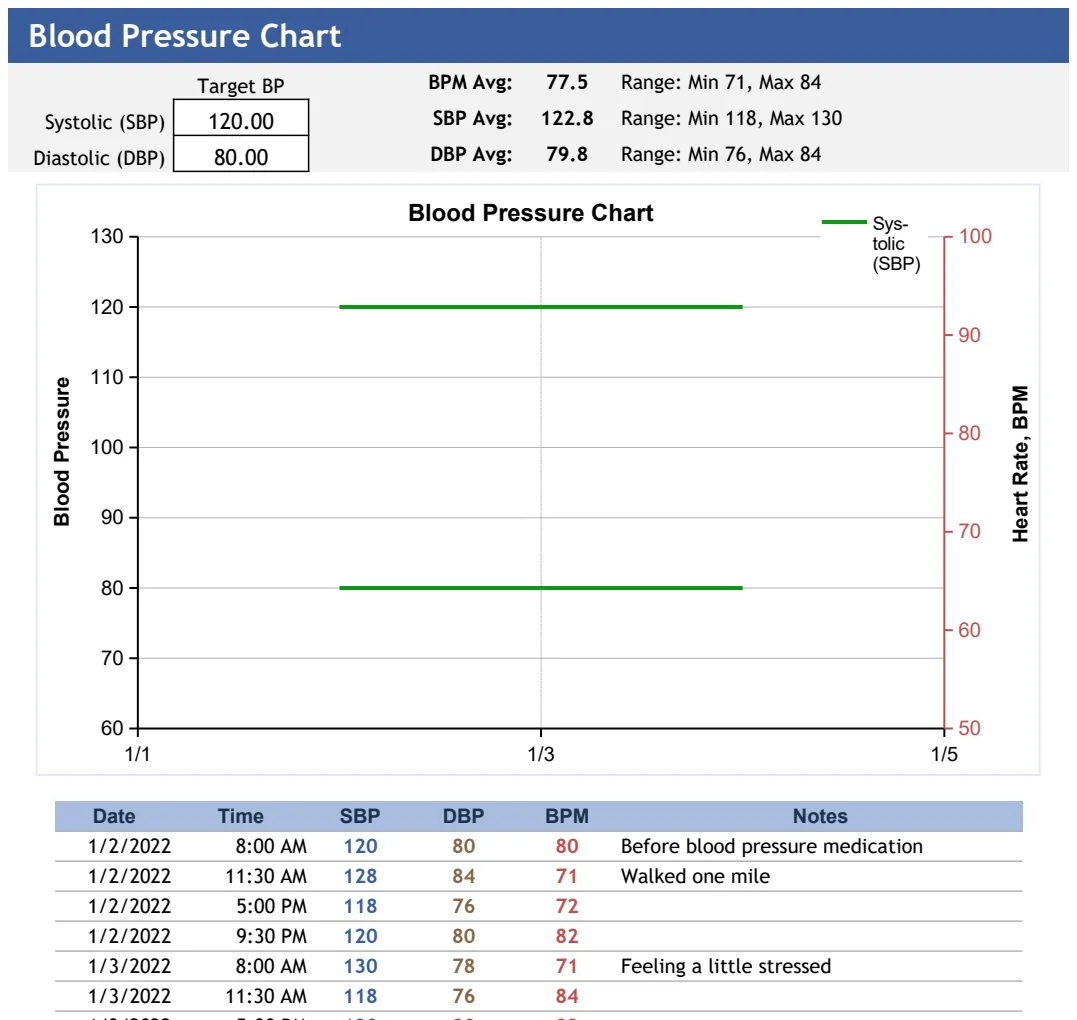
Blood Pressure Chart
Track and visualize daily blood pressure readings with automated averaging and trend analysis.
- Automatic calculation of systolic and diastolic averages
- Visual chart displaying BP readings over time
- Date-based logging with BPM tracking