
Break Even Analysis
Calculate your break-even point and understand when your business becomes profitable.
This template helps you determine the exact sales volume or revenue needed to cover all costs and reach profitability. By inputting your fixed costs, variable costs per unit, and selling price, the template automatically calculates your break-even point in units and dollars, plus the margin of safety to gauge business viability.
Ideal for business owners, entrepreneurs, and financial planners evaluating product viability, pricing strategies, or investment decisions. Remove guesswork from profitability forecasts and make data-driven pricing and production decisions.
What's inside
- Automatic break-even point calculation in units and revenue
- Fixed vs. variable cost separation and tracking
- Contribution margin and margin of safety metrics
- Error handling for invalid inputs
- Dynamic updates as costs and prices change
Download this template
.xlsx · 1 sheet
$9/monthDownload up to 10 templates a month from a library of thousands. Cancel anytime.
- 10 downloads every month
- Cancel anytime
- 14-day refund policy
More in Business Planning & Strategy
 Business Planning & Strategy
Product Costing Sheet Format in Excel: Materials, Labour, Overhead & Selling Price
A costing sheet format in Excel that builds the true cost per unit of every product or recipe from materials with waste, labour by operation and allocated overheads, then prices it at your target margin. Works as a product costing template, cost sheet template and food or recipe costing template.
- 11 connected tabs, from a quick-start guide to Settings
- Classic cost sheet format: prime cost, works cost, cost of production, cost of sales
- Bill of materials or recipe with waste % per line
 Business Planning & Strategy
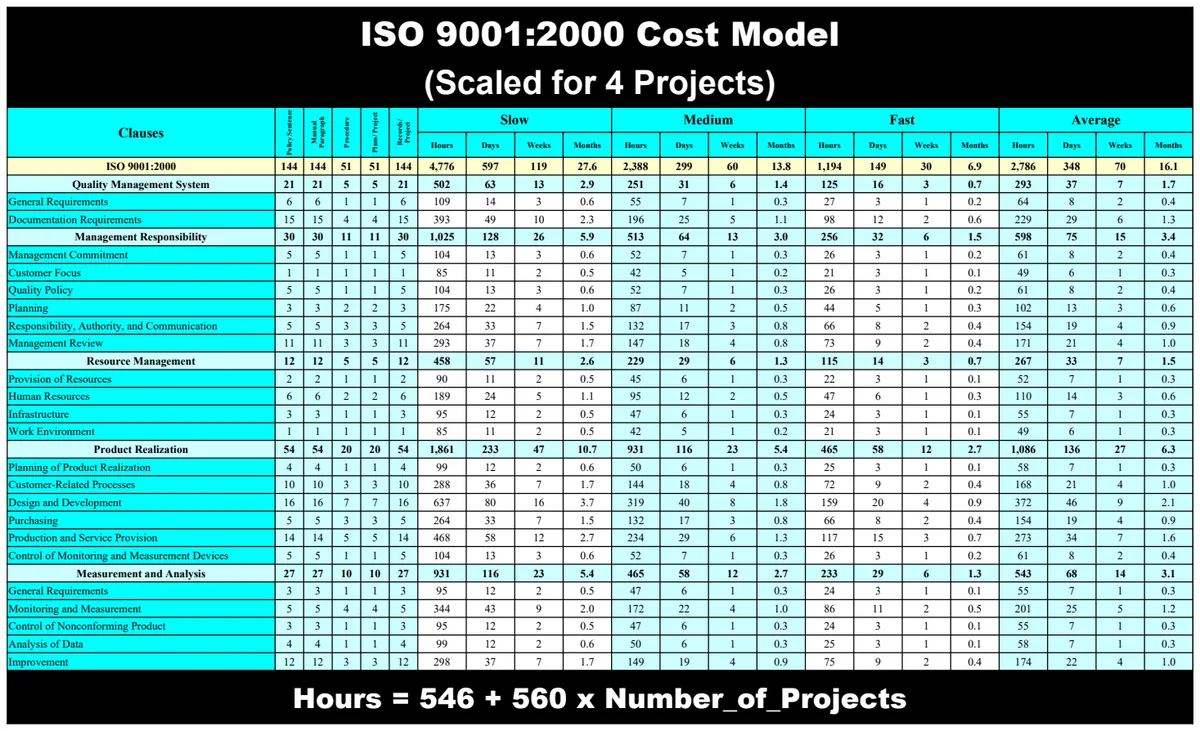
ISO 9001:2000 Cost Model
Track quality management system costs across ISO 9001:2000 clauses and project phases.
- Multi-project cost scaling
- Clause-by-clause cost breakdown
- Documentation phase cost tracking
 Business Planning & Strategy
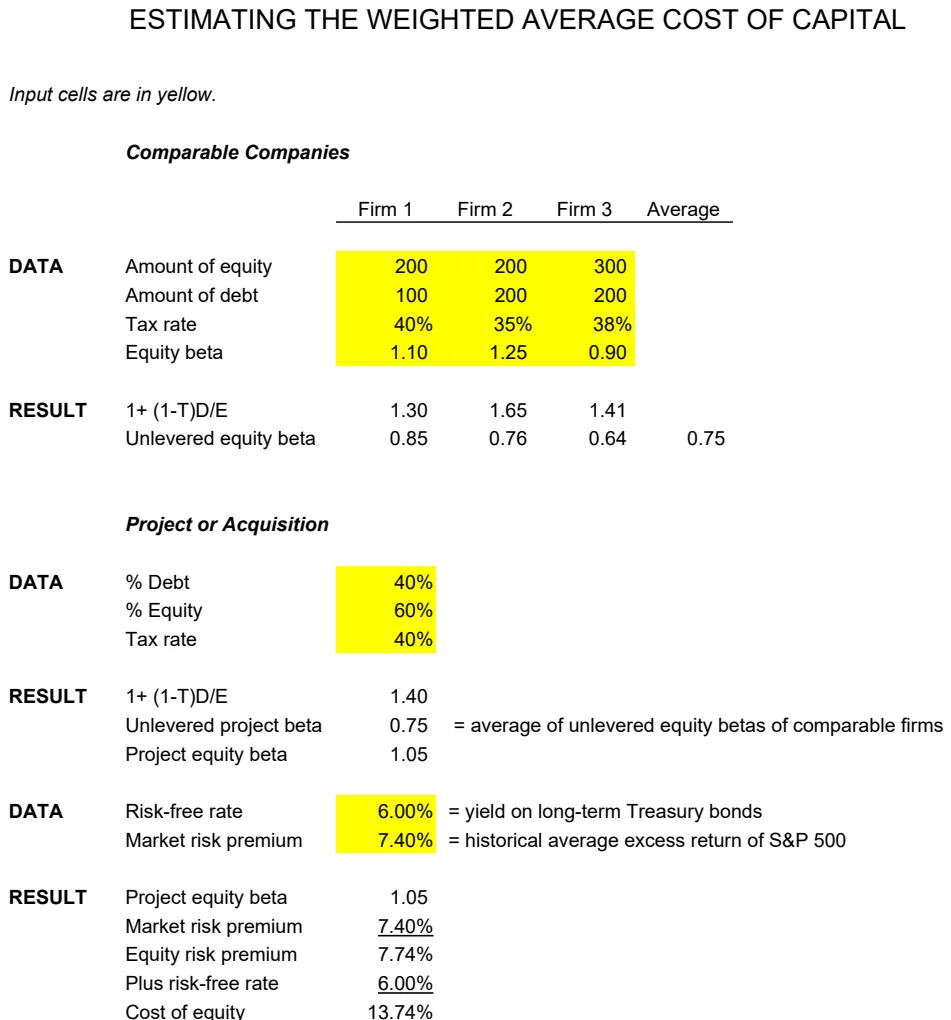
WACC Calculator with Comparable Companies Analysis
Calculate weighted average cost of capital using comparable company benchmarking and financial inputs.
- Comparable company data input fields
- Automatic WACC calculation
- Average metrics across peer companies
 Business Planning & Strategy
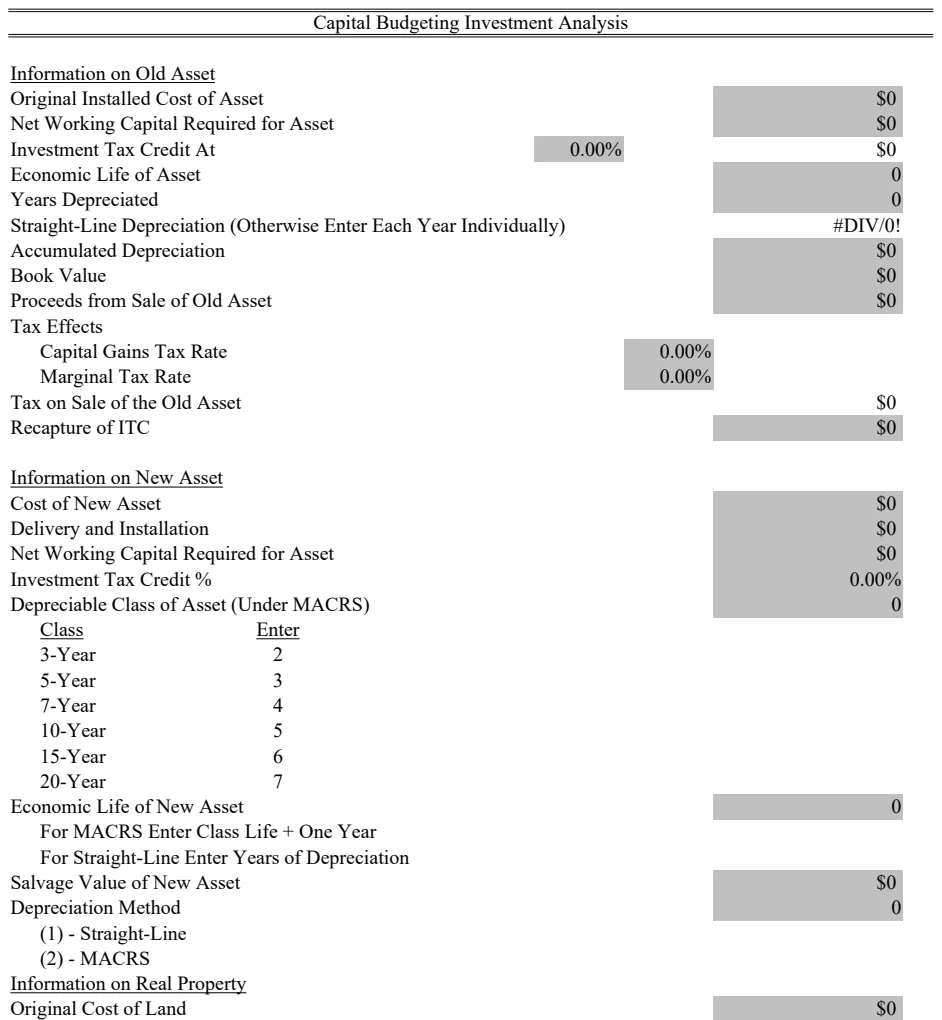
Capital Budgeting Investment Analysis
Evaluate investment decisions with NPV and IRR calculations across multi-year cash flow projections.
- 10-year cash flow modeling
- NPV and IRR automated calculation
- Old vs. new asset comparison