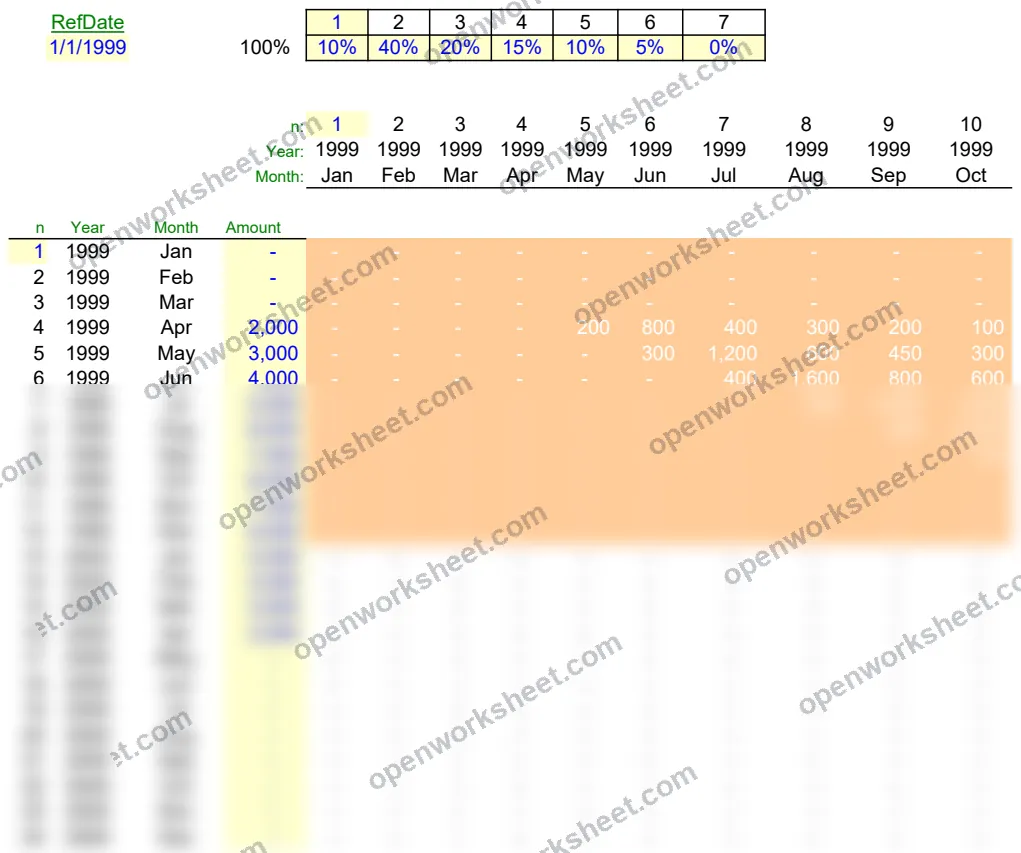
Cashflow Matrix
Track daily cash positions across multiple accounts with rolling date columns and automated summation.
This template creates a dynamic cashflow matrix that shows cash balances or movements across different accounts or cost centers on a rolling daily basis. Each column represents a successive day, with formulas automatically calculating the next date and summing totals across rows. It's designed for businesses and finance teams who need to monitor liquidity positions, forecast short-term cash requirements, or analyze cash distribution patterns without manual date entry.
The template uses EDATE and date arithmetic to maintain a continuous timeline, HLOOKUP for data retrieval, and conditional logic with IF/ISNA to handle missing or invalid data. This makes it ideal for daily cash management, treasury operations, and operational finance reviews where quick visibility into cash positions is critical.
What's inside
- Auto-incrementing date columns (EDATE formulas)
- Row summation across accounts or cost centers
- Conditional lookup with HLOOKUP and ISNA error handling
- Horizontal matrix layout for period-over-period comparison
- Email integration sheet for distribution
Download this and everything else
.xlsx · 2 sheets
$29$9once for thousands of templates. No subscription.
- Limited-time offer, normally $29
- One payment, no subscription
- 14-day refund
More in Accounting & Bookkeeping
 Accounting & Bookkeeping
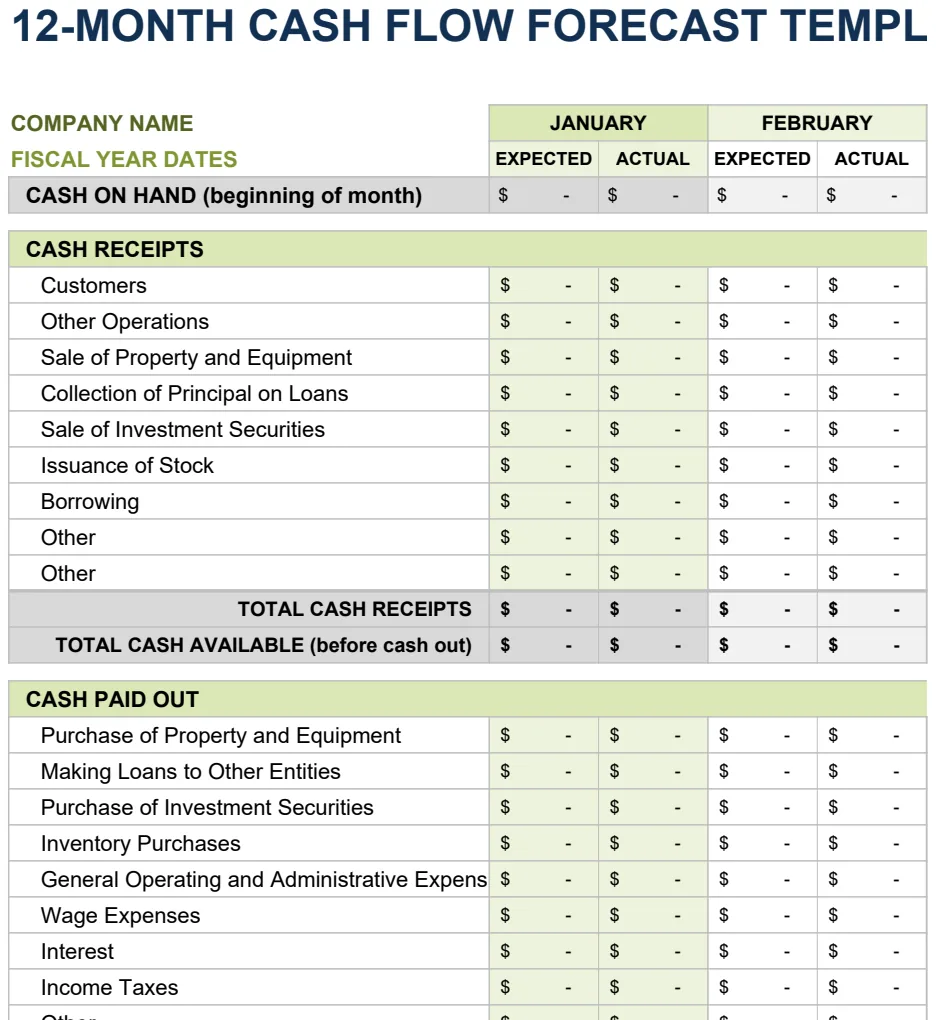
12 Month Cash Flow Forecast
Project monthly cash inflows and outflows to manage liquidity and plan for operating expenses.
- 12-month rolling forecast with expected vs. actual columns
- Month-by-month cash inflow and outflow tracking
- Automatic SUM calculations for cash position
 Accounting & Bookkeeping
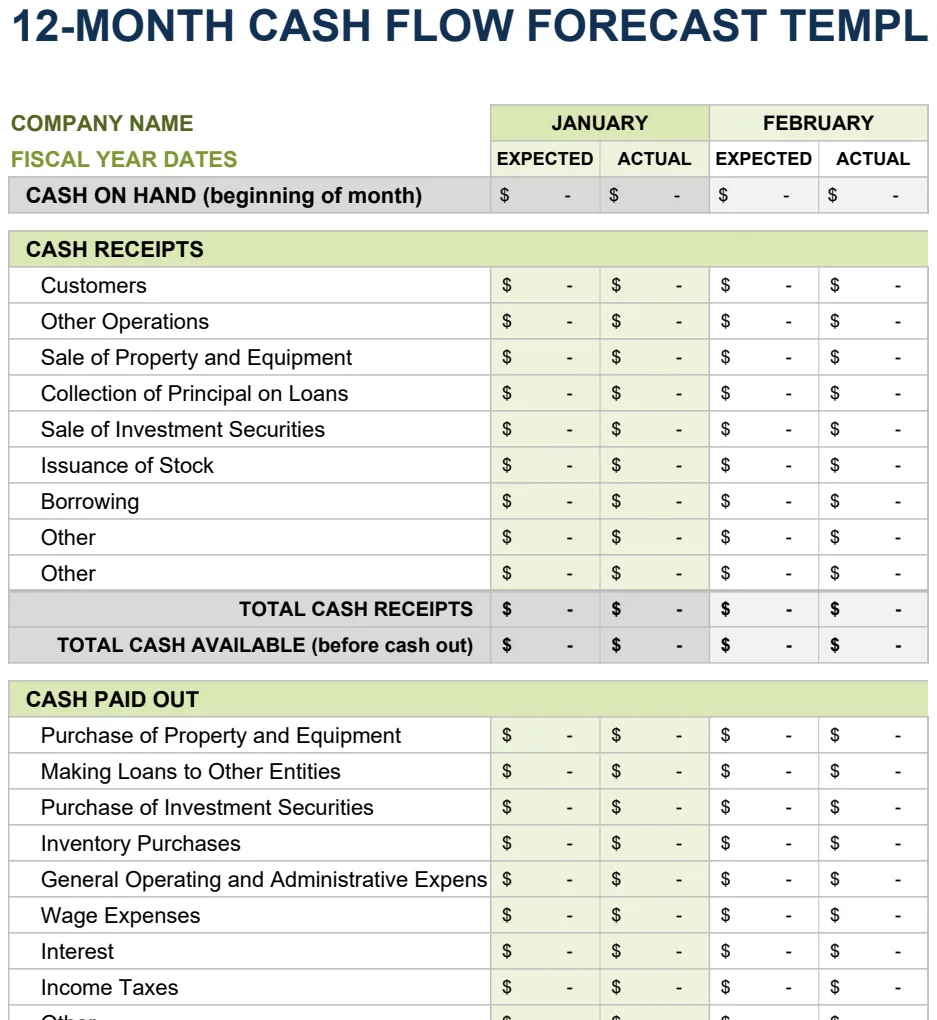
12 Month Cash Flow Forecast
Project monthly cash inflows and outflows to manage liquidity and financial planning.
- 12-month rolling projection with expected vs actual columns
- Monthly period comparison structure
- Automated SUM formulas for period totals
 Accounting & Bookkeeping
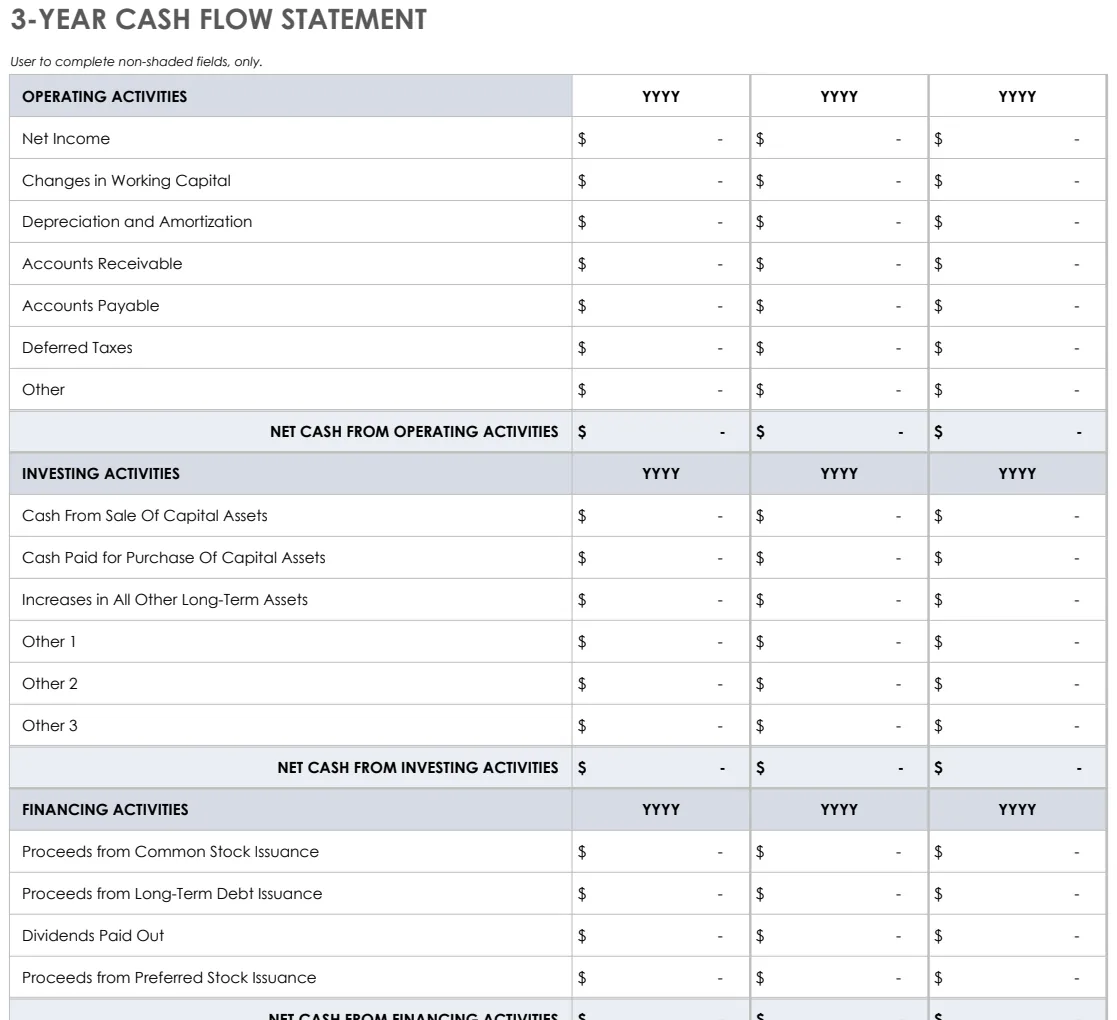
3 Year Cash Flow Statement
Track operating, investing, and financing cash flows across three years with pre-built formulas.
- Three statement formats (3-year, yearly, 12-month)
- Pre-built SUM formulas for automatic calculations
- Color-coded input areas for easy data entry
 Accounting & Bookkeeping
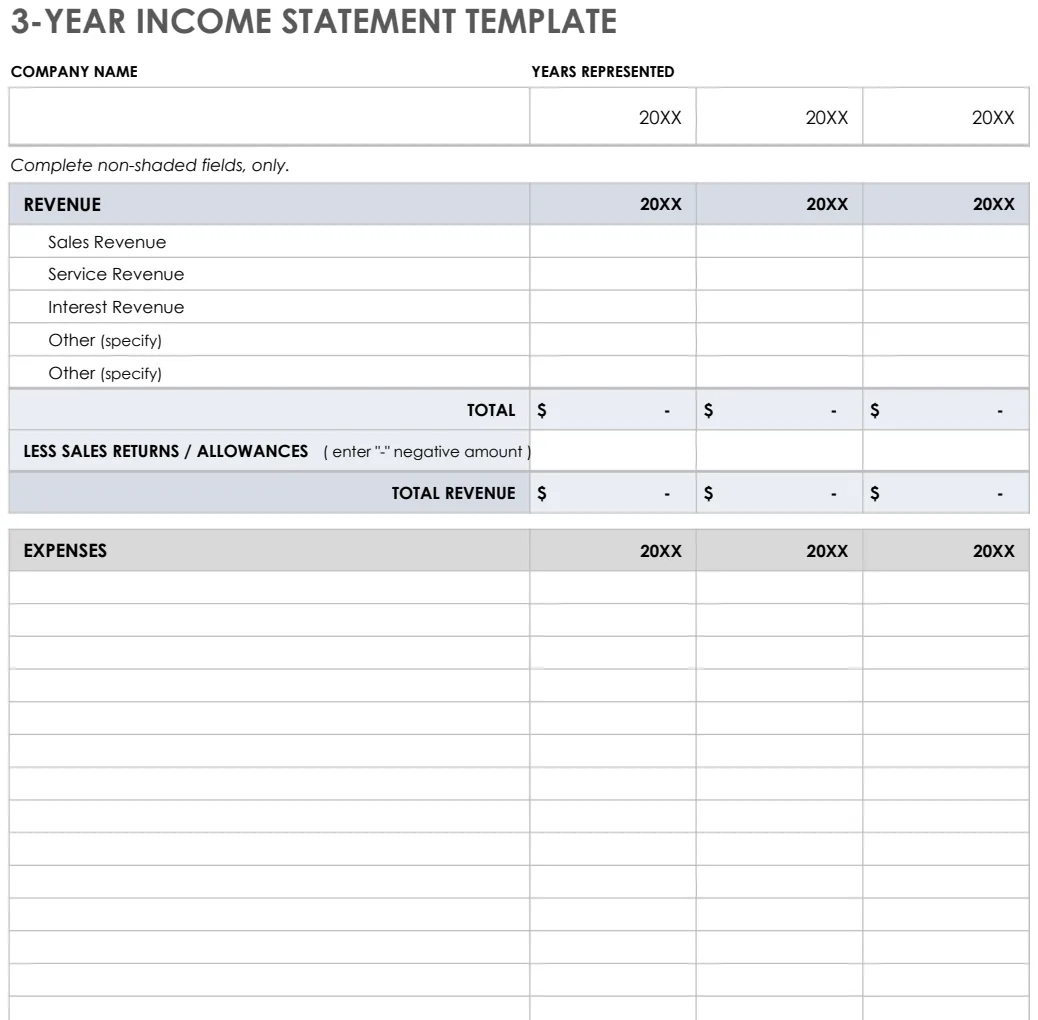
3 Year Income Statement
Track revenue, expenses, and net income across three years to analyze financial trends and performance.
- Pre-formatted rows for revenue and expense categories
- Automatic SUM formulas for totals and subtotals
- Three-year side-by-side comparison columns