
Daily Report of Stock In And Out
Track daily inventory movements with beginning stock, inflows, outflows, and closing balances.
This template records daily stock transactions including product inflows and outflows against beginning inventory. It uses SUM functions to calculate totals and TODAY function for automatic date tracking, enabling accurate inventory reconciliation. Perfect for warehouse managers, retail operations, and supply chain teams who need to monitor stock levels daily and identify discrepancies quickly.
What's inside
- Product name and specification fields
- Unit of measure tracking
- Beginning inventory column
- SUM formulas for daily totals
- TODAY function for automatic dating
- Stock in and out movement tracking
Download this template
.xlsx · 1 sheet
$9/monthDownload up to 10 templates a month from a library of thousands. Cancel anytime.
- 10 downloads every month
- Cancel anytime
- 14-day refund policy
More in Inventory & Operations
 Inventory & Operations
Manufacturing BOM, Inventory & COGS Tracker
A bill of materials and inventory system in Excel. Log a build and raw materials are consumed through the BOM, cost of goods sold is calculated at weighted average cost and stock levels update at the same time.
- 11 connected tabs, from a quick-start guide to Settings
- Bill of materials with quantity per unit and waste %
- Builds consume raw materials automatically
 Inventory & Operations
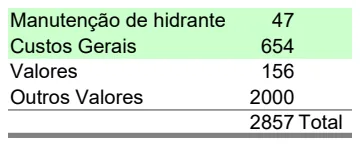
Hydrant Maintenance Cost Tracker
Track hydrant maintenance costs and expenses with automatic calculations for budget oversight.
- Automatic cost summaries with SUM formulas
- Categorized expense tracking (General Costs, Values)
- Line-item maintenance records
 Inventory & Operations
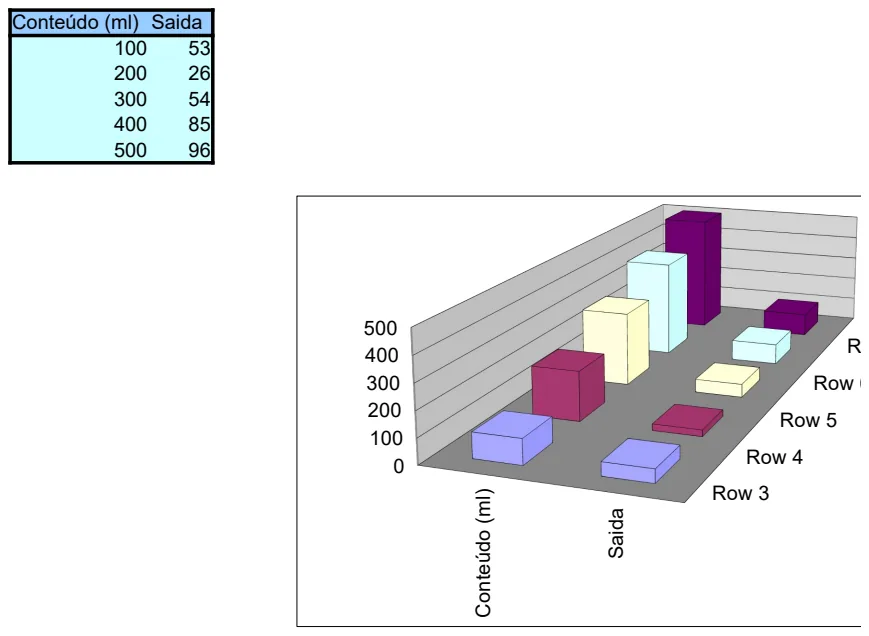
Beverage Yield Calculator
Calculate beverage output based on content volume to optimize portions and waste.
- Input/output tracking
- Yield ratio calculations
- Visual charts for trend analysis
 Inventory & Operations
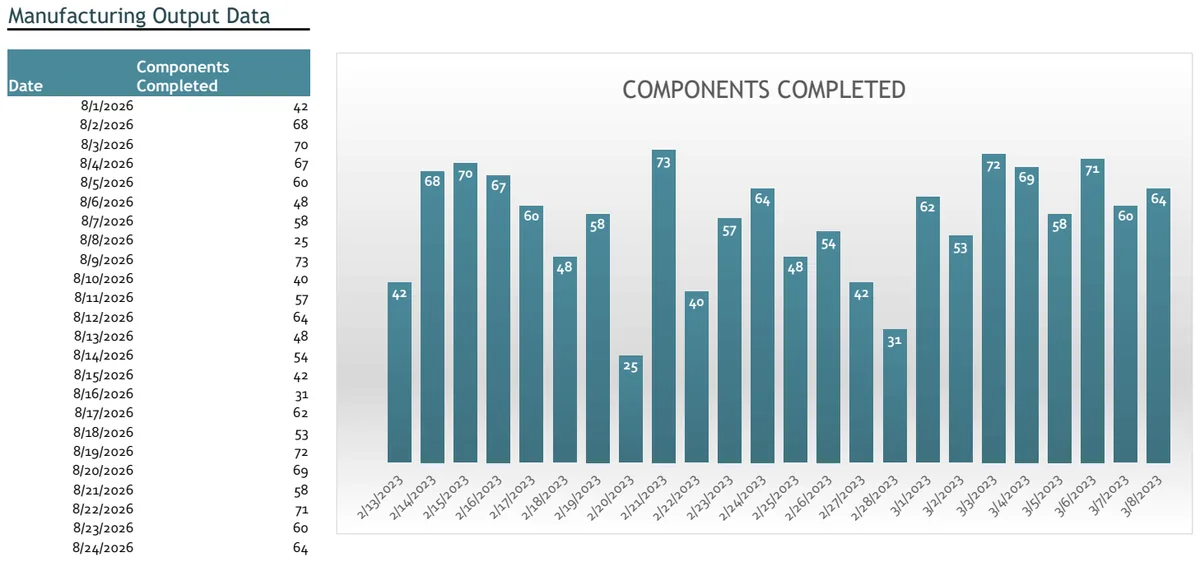
Manufacturing Output Chart
Track daily component production with auto-updating output data and visual charts.
- Auto-updating date field with TODAY() function
- Daily component completion logging
- Production output visualization with charts