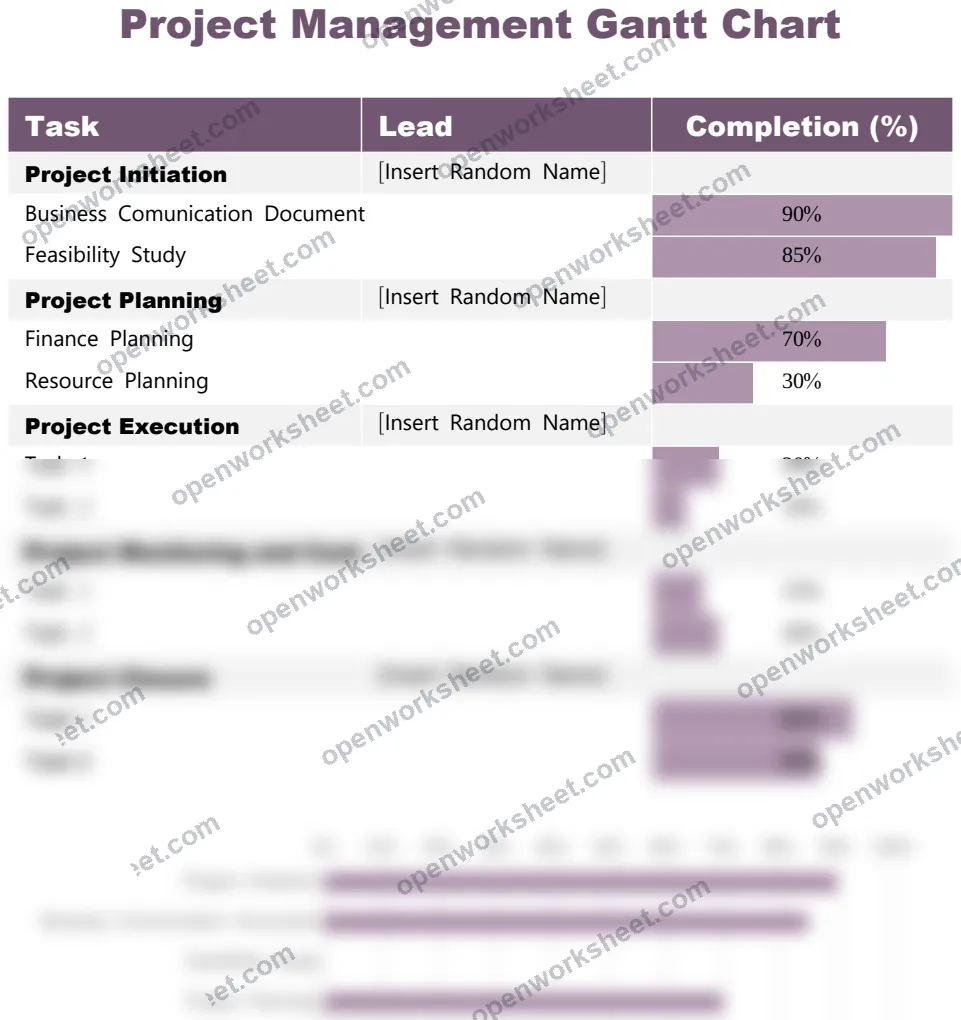
Project Management Gantt Chart
Visual timeline chart to plan tasks, track progress, and manage project schedules at a glance.
This Gantt chart template helps project managers organize tasks sequentially, assign owners, and monitor completion percentages across project phases. It provides a clear visual representation of task dependencies and timelines, making it easy to identify delays and resource bottlenecks. Perfect for teams managing complex projects who need a straightforward way to communicate schedules to stakeholders and keep everyone aligned on deadlines and deliverables.
What's inside
- Visual timeline display with task bars
- Task owner assignment and accountability
- Completion percentage tracking
- Sequential task dependency visualization
- Progress monitoring at a glance
Download this and everything else
.xlsx · 1 sheet · includes charts
$29$9once for thousands of templates. No subscription.
- Limited-time offer, normally $29
- One payment, no subscription
- 14-day refund
More in Project Management
 Project Management
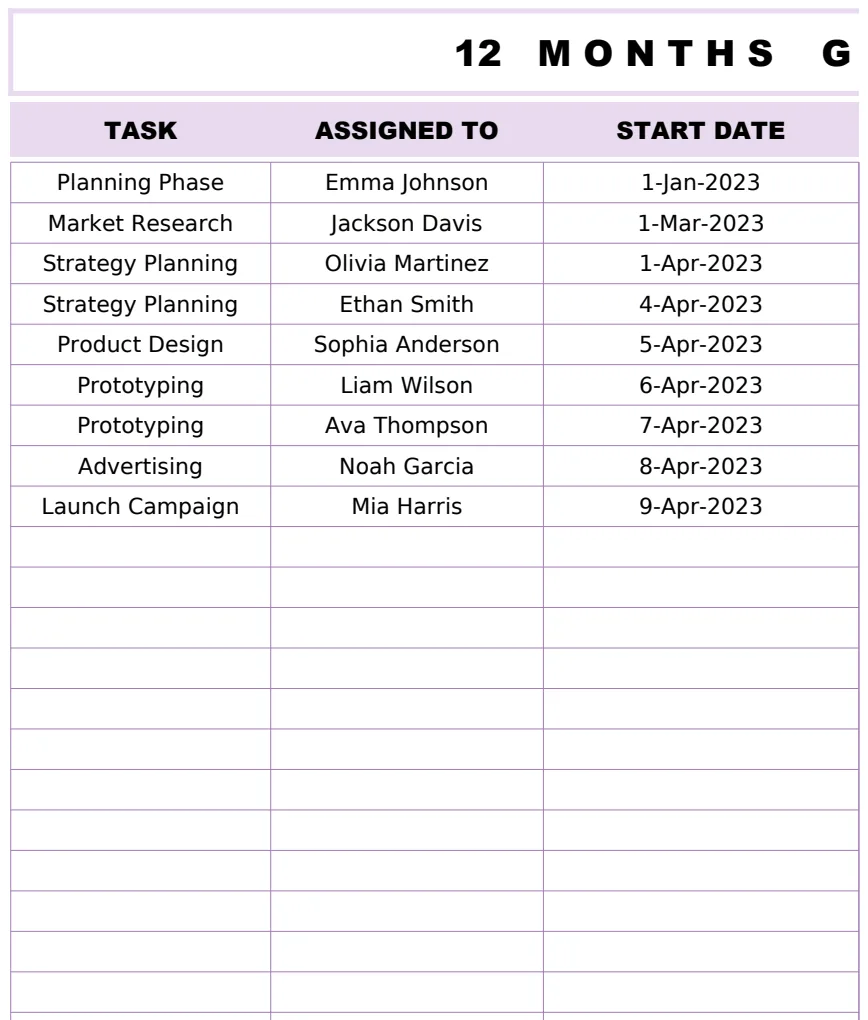
12 Months Gantt Chart Template
A professional 12-month project timeline visualization with task tracking, assignments, and duration calculations using Gantt chart methodology.
- Automatic duration calculation between start and end dates
- 12-month visual timeline representation
- Task assignment tracking
 Project Management
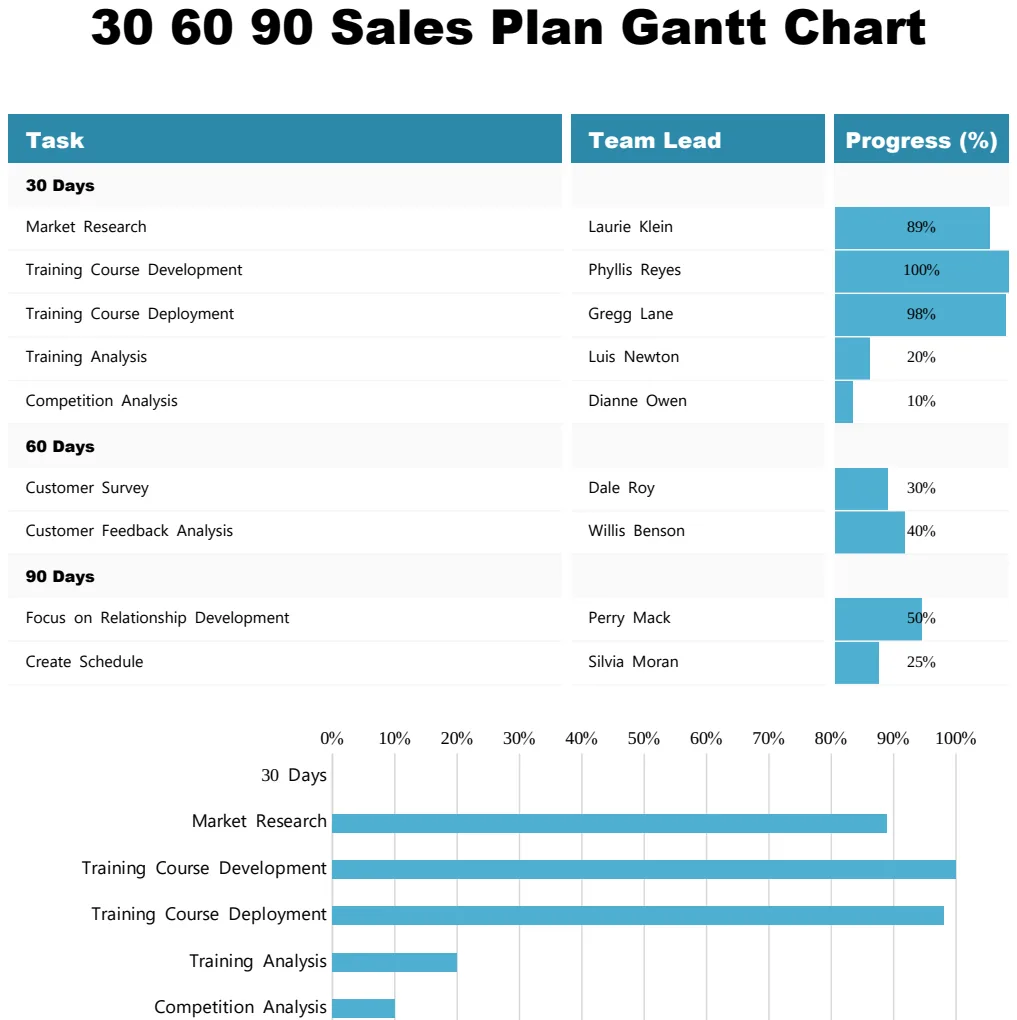
30 60 90 Sales Plan Gantt Chart
Visualize your 90-day sales plan with a Gantt chart showing tasks, team leads, and progress milestones.
- Task-by-task breakdown across 30, 60, and 90-day phases
- Team lead assignment per task
- Visual progress percentage tracking
 Project Management
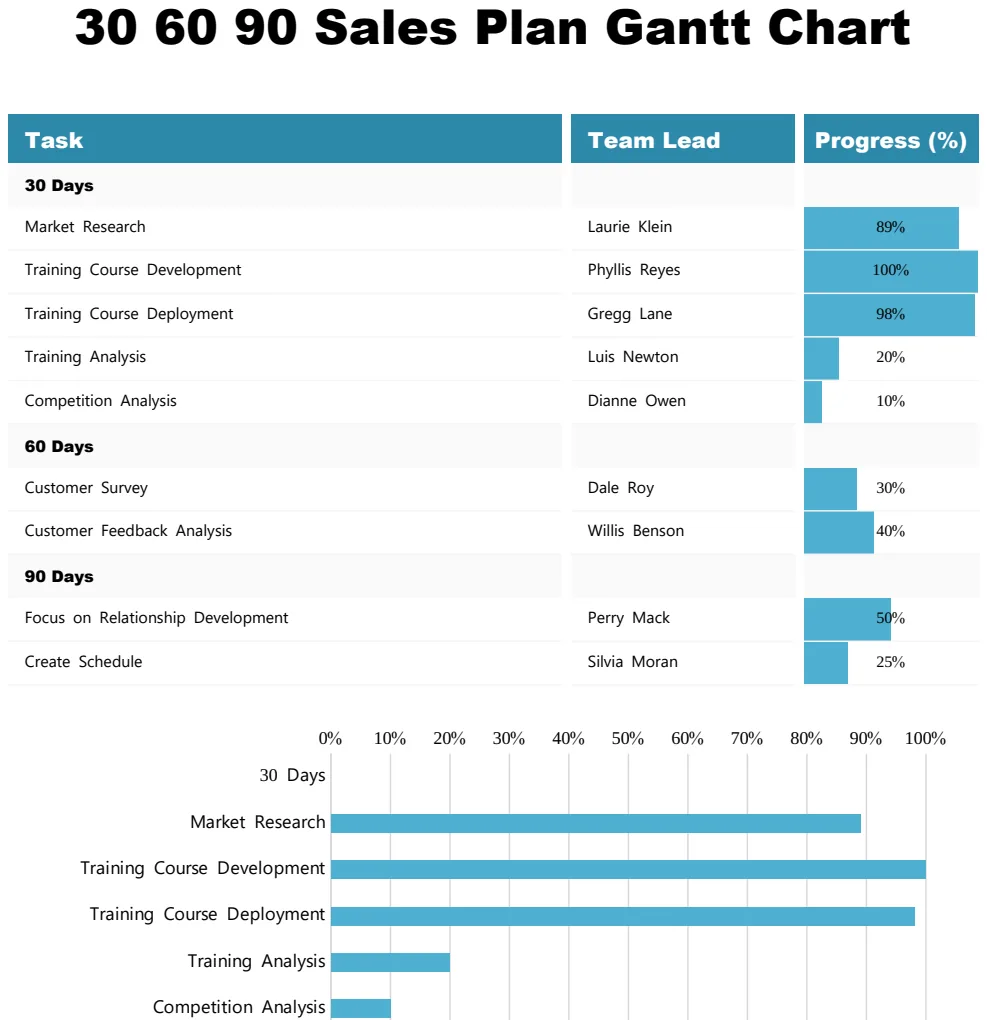
30 60 90 Sales Plan Gantt Chart
Track sales goals and milestones across 30, 60, and 90-day periods with visual progress tracking.
- Gantt timeline visualization
- Progress percentage tracking by task
- Team lead assignment column
 Project Management
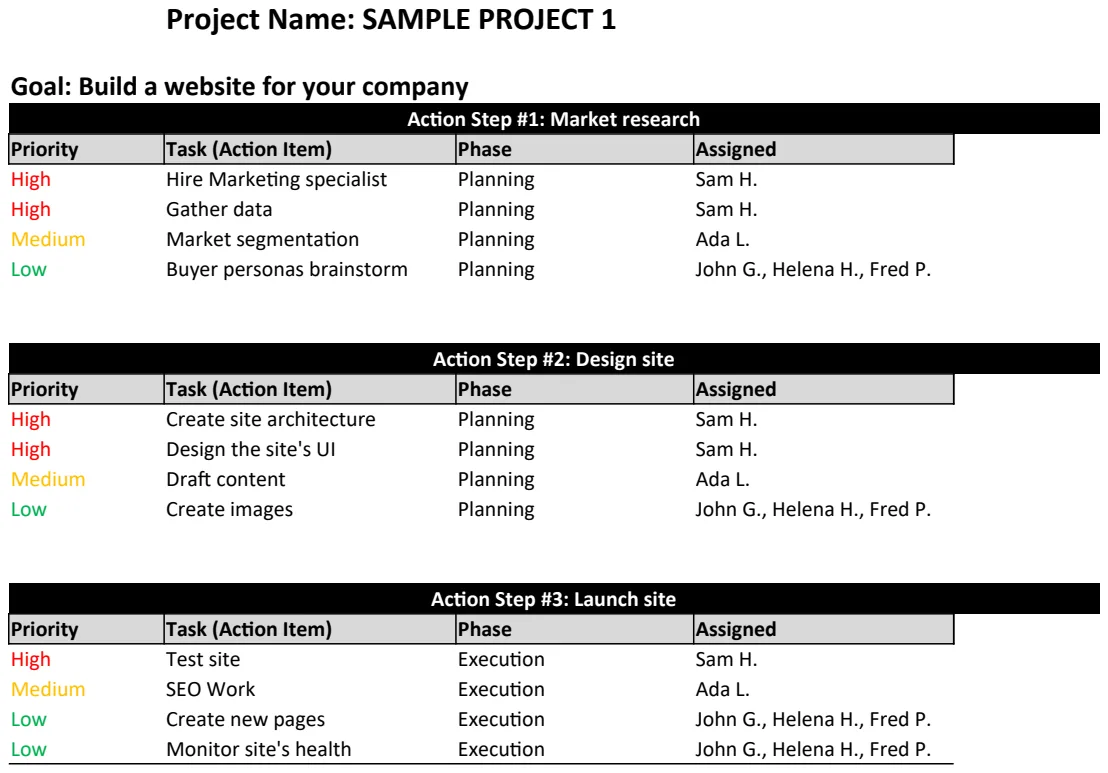
Action Plan Template
Structure project goals into actionable steps with timelines and ownership to drive execution.
- Project name and goal fields
- Action step numbering and description
- Timeline assignment per step