
Excel Timeline Template: Project Timeline, Milestones & Gantt Chart
An Excel timeline template that draws itself: list tasks, milestones and events, and get a timeline chart with labels placed above and below the axis, colours by category, zoom by week, month, quarter or year, a live Gantt chart and a project dashboard.
Project Timeline & Milestone Maker turns a simple list into a finished timeline chart in Excel. Add each milestone or event with its date and category on the Plan tab and it appears on the Timeline, alternating above and below the axis at three heights so labels do not overlap. Each category has its own colour, a dashed line marks today, and the axis labels switch between weeks, months, quarters and years to fit the period you show.
Zoom by typing a window start and end on Settings: close in on one busy month, or pull out to a multi-year programme. Leave the window blank and it fits itself to your dates. The Timeline tab prints on one landscape page with a table of the milestones and events shown, so it is ready for a status report or a slide.
Tasks carry a start date and an end date or a duration in workdays. Weekends and the holidays you list are skipped, and a task that depends on an earlier item starts the next working day after it finishes, so when something slips the work after it moves too. The Gantt chart shows every task as a bar shaded by % complete, late work in red, milestones as diamonds and today's column highlighted, across 60 columns of days, weeks, months or quarters.
The Dashboard shows overall progress weighted by workdays, milestones hit, late items with days overdue, items due soon, progress by category, the next milestones and events, and open work by owner. Status is worked out from a status date you can set, so reports stay consistent.
It works for project timelines, product launches, marketing calendars, event plans and history timelines: rename the six categories as phases, teams, workstreams or eras. Capacity covers 100 items, with the first 24 in the window plotted on the chart. Calculated cells are locked and sheet protection has no password. Sample data from a fictional app launch is included. Built for Microsoft Excel 2016 or later (desktop or Excel for the web) and contains no macros.
What's inside
- 6 connected tabs, from a quick-start guide to Settings
- Timeline chart that positions milestones and events automatically
- Labels above and below the axis at three heights
- Six colour-coded categories you can rename
- Zoom by window with week, month, quarter or year axis labels
- Today marker on the timeline and the Gantt
- Tasks with workday durations and holidays
- Dependencies that move later work when something slips
- Gantt chart by day, week, month or quarter
- % complete shading and late work in red
- Dashboard with progress, late items and next milestones
- Open work by owner
- One-page printable timeline
- Locked formulas, no macros
Download this template
.xlsx · 6 sheets · includes charts
$9/monthDownload up to 10 templates a month from a library of thousands. Cancel anytime.
- 10 downloads every month
- Cancel anytime
- 14-day refund policy
More in Project Management
 Project Management
Freelance Command Center
An all-in-one Excel workbook for freelancers. Projects, tasks, time, invoices and expenses roll up into a live dashboard with KPIs, deadlines and charts.
- 9 connected tabs, from a quick-start guide to Settings
- Dashboard with 10 KPI cards and 2 charts
- 12-month performance table and next 10 deadlines
 Project Management
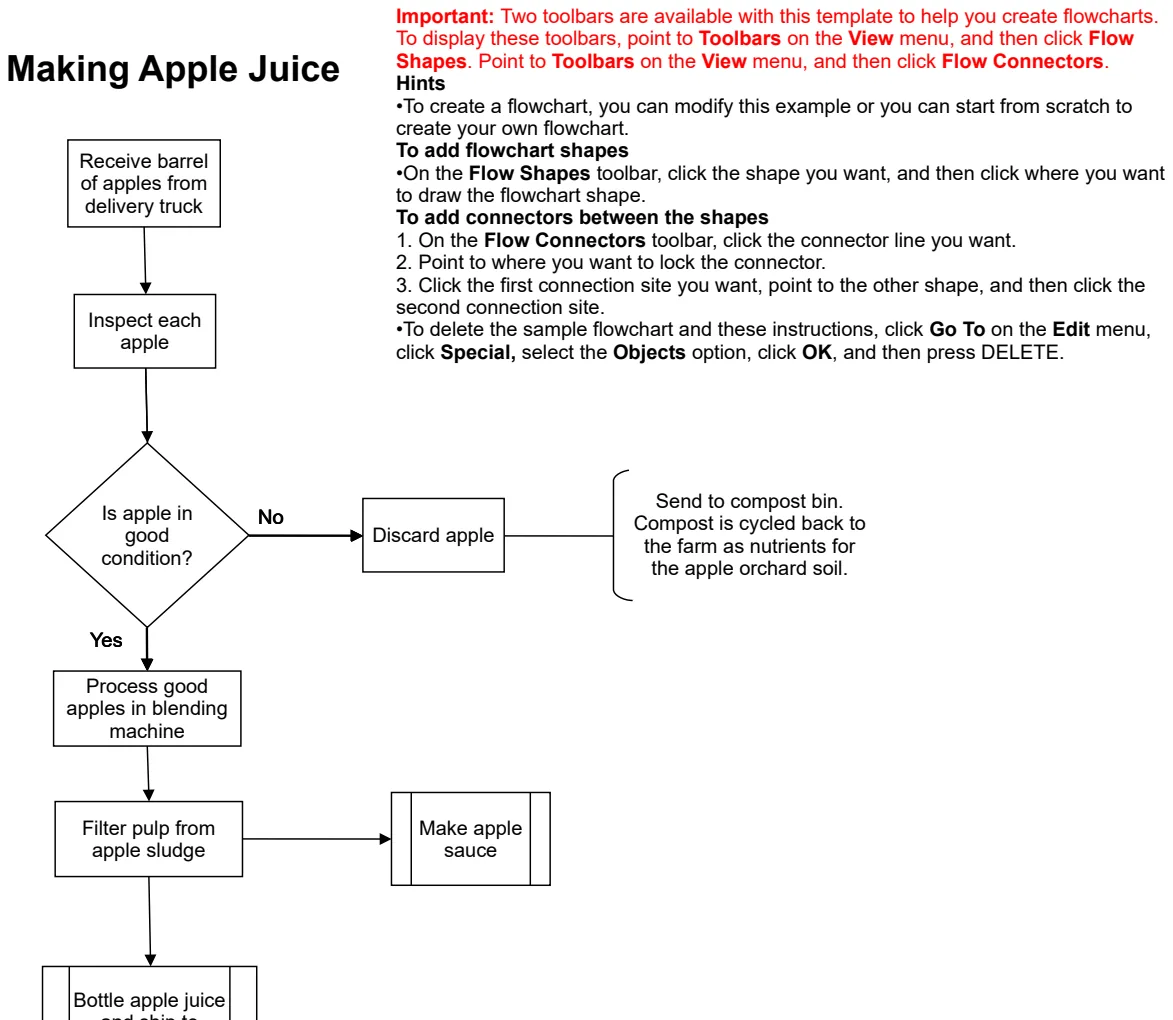
Simple Flowchart Template
Create process flows and decision diagrams visually in Excel without external design tools.
- Pre-formatted shapes for process steps
- Connector lines for flow direction
- Decision diamond shapes for conditional branches
 Project Management
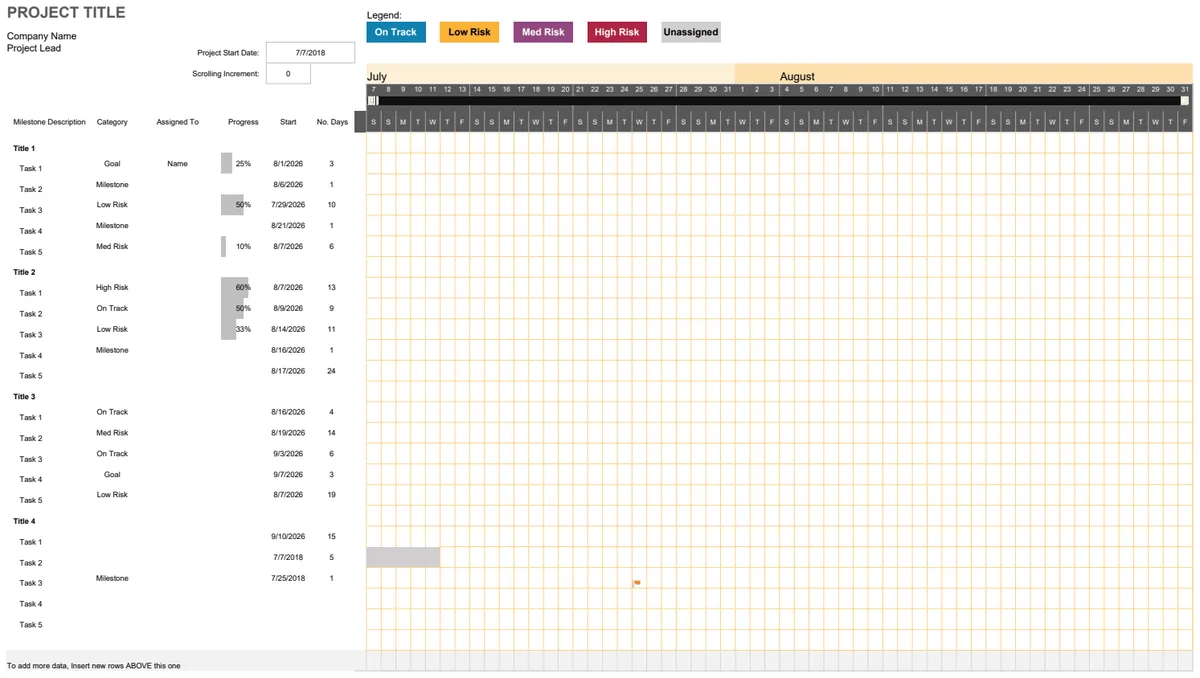
Agile Gantt Chart
Visual project timeline with milestones, tasks, and team assignments for agile project planning.
- Auto-calculated project duration and dates
- Dynamic legend with milestone color coding
- Project lead and company name fields
 Project Management
Ultimate Project Tracker
Manage projects, tasks, and timelines with Kanban boards, Gantt charts, and dashboard analytics.
- Kanban view for task status workflow
- Gantt chart for timeline visualization
- Centralized project database