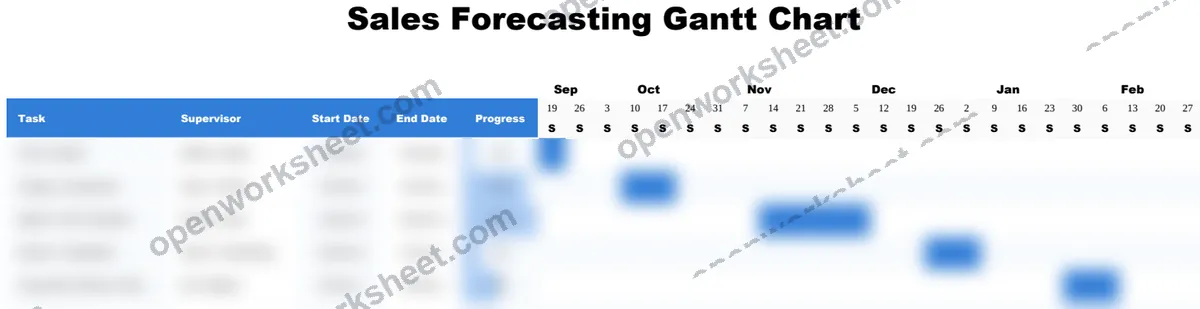
Sales Forecasting Gantt Chart
Visualize sales pipeline milestones and forecast timelines with task tracking and progress monitoring.
This template combines sales forecasting with Gantt chart visualization to track key revenue-driving activities across time. It displays task dependencies, supervisor accountability, and real-time progress updates to keep teams aligned on forecast delivery.
What's inside
- Task-based timeline view with start and end dates
- Supervisor assignment for accountability
- Progress percentage tracking by task
- Monthly calendar integration for visual scheduling
- Automatic progress calculation from baseline metrics
Download this and everything else
.xlsx · 1 sheet
$29$9once for thousands of templates. No subscription.
- Limited-time offer, normally $29
- One payment, no subscription
- 14-day refund
More in Sales & CRM
 Sales & CRM
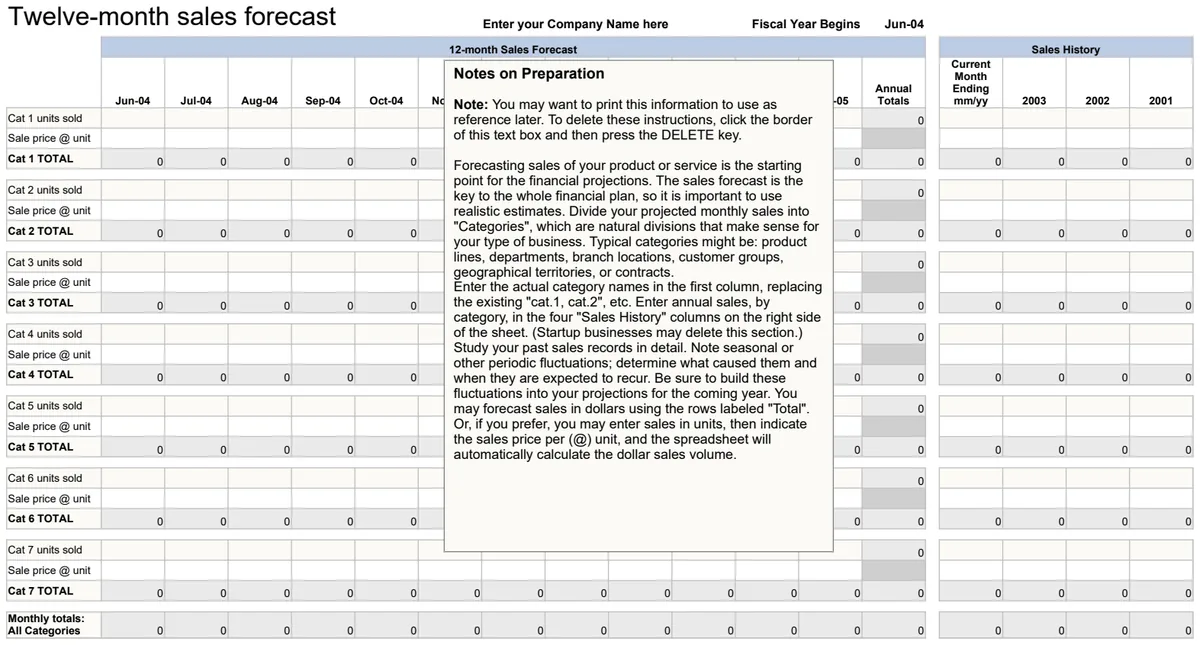
12 Month Sales Forecast
Project monthly revenue for the next 12 months with automated date calculations and totals.
- Automated month-by-month date generation
- Monthly sales amount entry fields
- Running total calculations across the year
 Sales & CRM
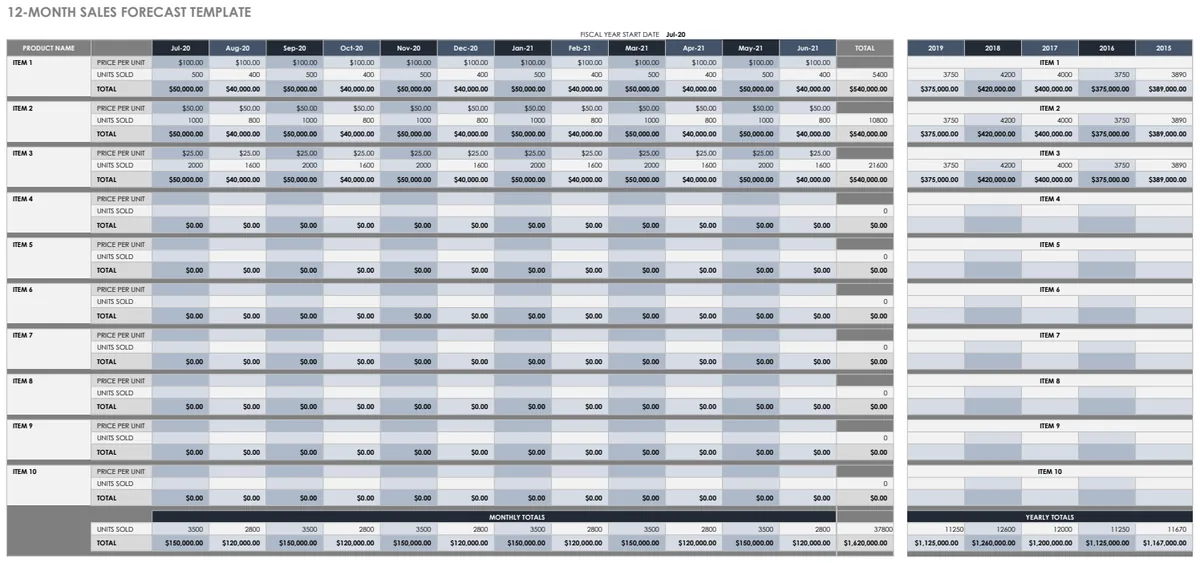
12 Month Sales Forecast Multiple Projects
Project-based sales forecasting across 12 months with pricing and unit tracking.
- 12-month rolling forecast view
- Multiple product/project lines
- Unit price and quantity tracking
 Sales & CRM
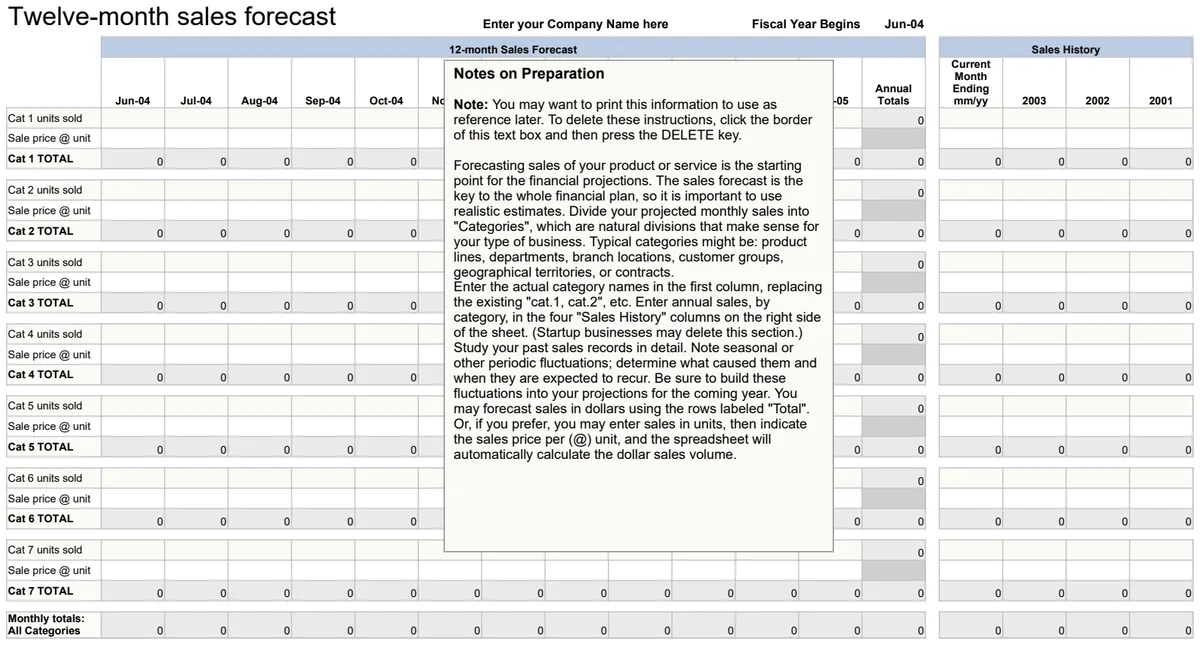
12-Month Sales Forecast
Project monthly revenue with automatic date calculations and rolling totals for annual planning.
- Automatic month-by-month date progression
- Summary totals for quarterly and annual sales
- Company name and fiscal year customization
 Sales & CRM
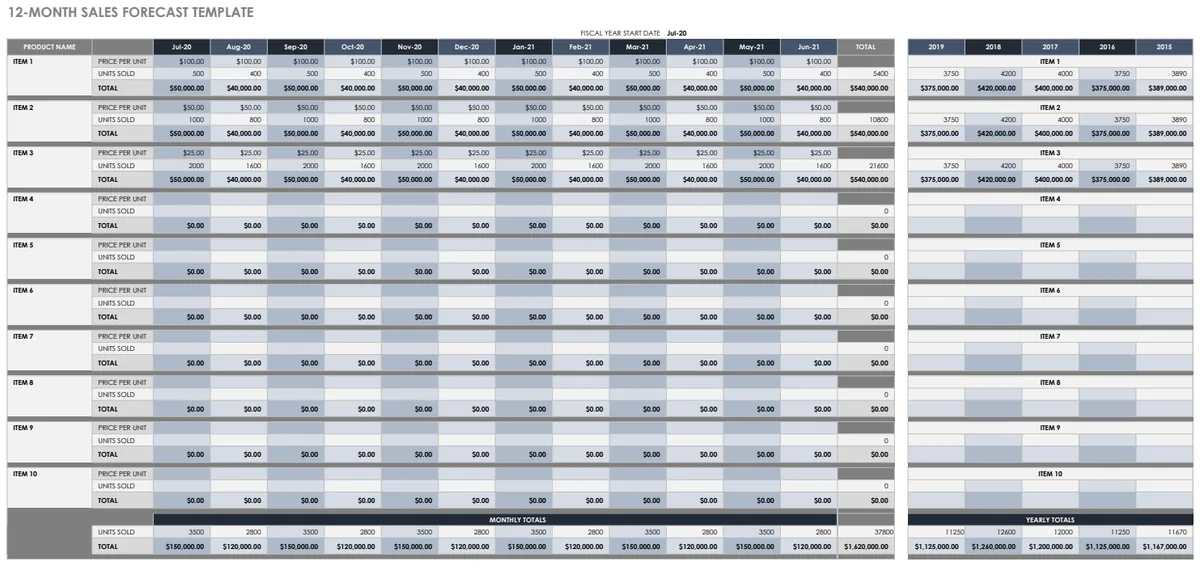
12-Month Sales Forecast Template
Project monthly revenue by product to plan inventory, staffing, and cash flow confidently.
- 12-month sales projection grid by product
- Automatic date calculation for each month
- Unit price and quantity tracking