Template library
3,445 templates.
 Sales & CRM
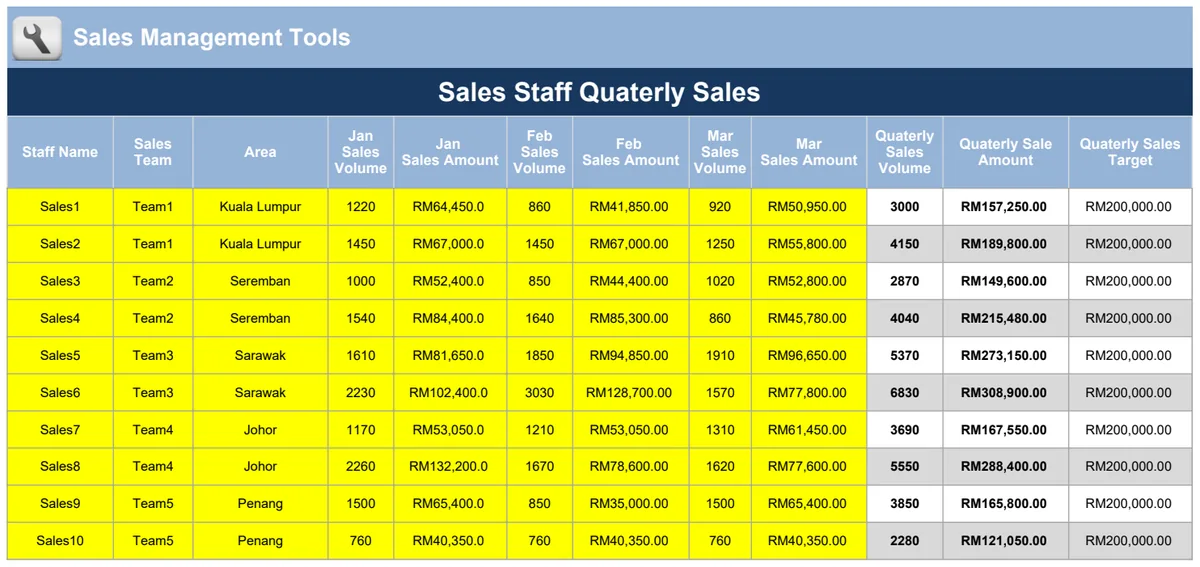
Sales Staff Quarterly Sales Tracker
Track individual and team sales performance by volume and revenue across quarters with area-based analysis.
- Monthly sales volume and revenue tracking by staff member
- Quarterly analysis aggregated by geographic area
- Automatic ranking of sales staff using RANK function
 Sales & CRM
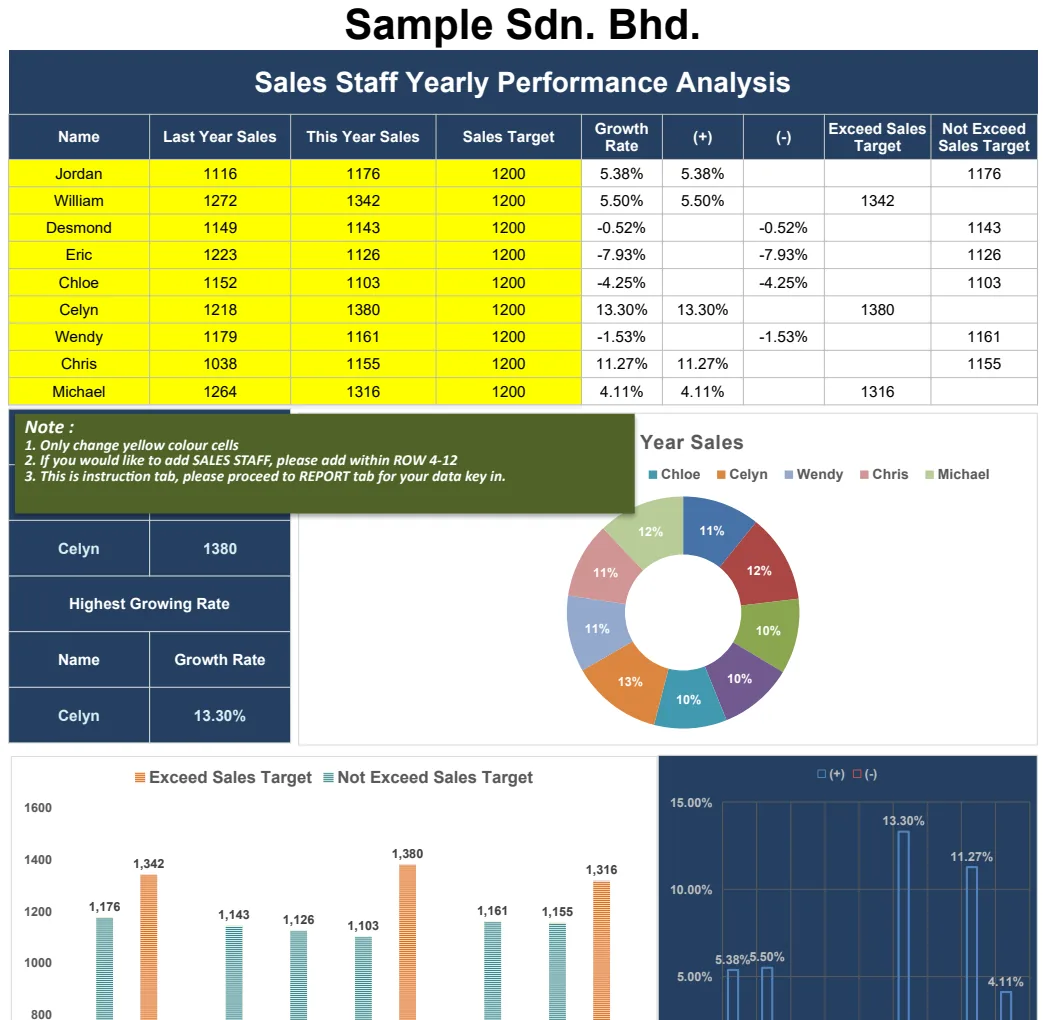
Sales Staff Yearly Performance Analysis
Track and compare sales staff performance against targets with growth metrics and visual charts.
- Year-over-year sales comparison
- Automatic growth rate calculation
- Performance vs. target tracking
 Sales & CRM
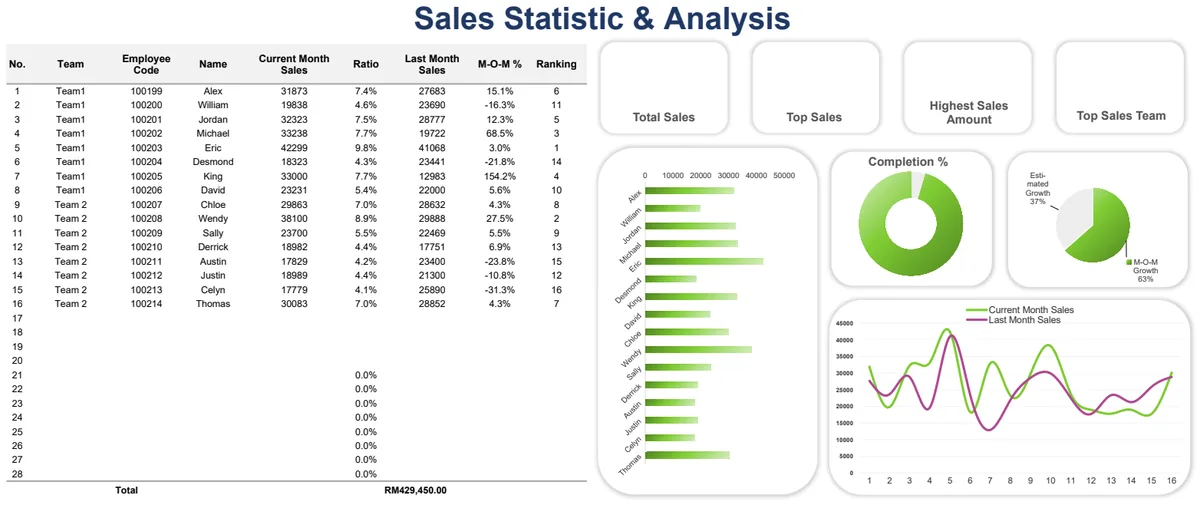
Sales Statistic & Analysis
Track team and individual sales performance with automated ranking and visual analysis.
- Automated ranking by sales amount
- AVERAGE and SUM calculations
- VLOOKUP employee lookup
 Sales & CRM
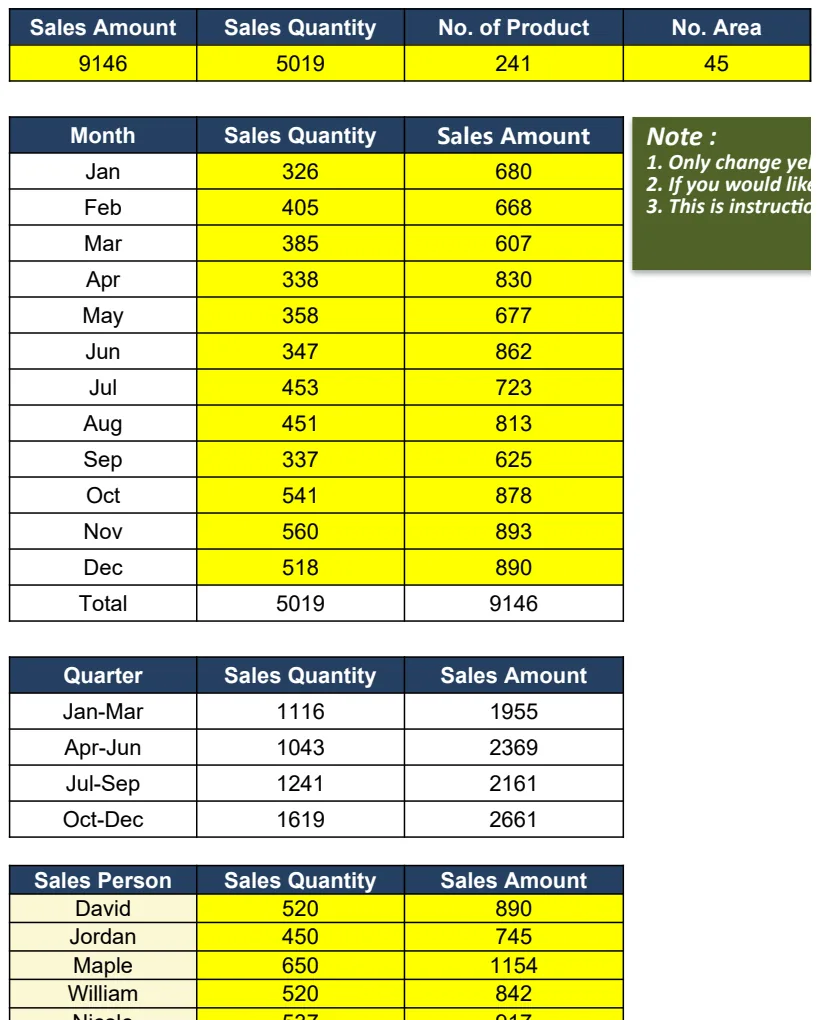
Sales Statistics Dashboard
Track sales amount, quantity, products, and areas with visual charts and summary metrics.
- Automatic SUM calculations
- Linked data formulas
- Sales quantity tracking
 Sales & CRM
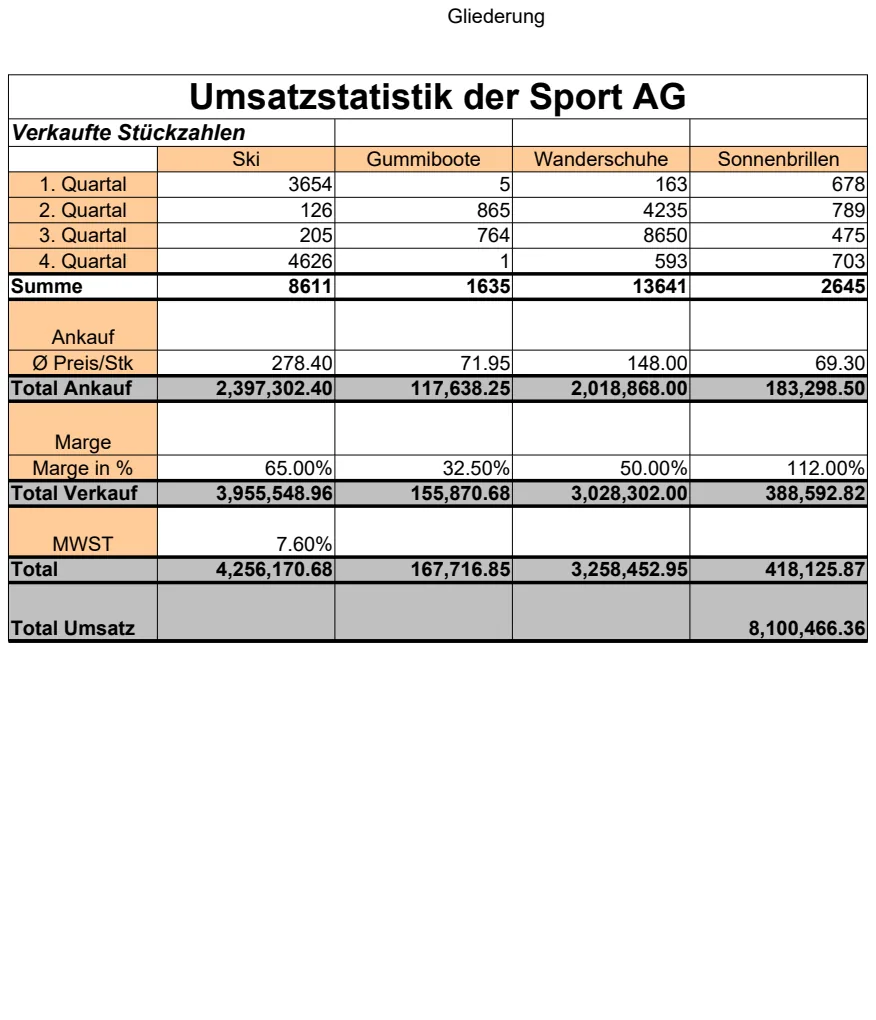
Sales Statistics Template for Sports Business
Track revenue and units sold by product category to analyze performance trends.
- Organized columns for each product type
- Automatic sum calculations for total sales
- Units sold tracking alongside revenue
 Sales & CRM
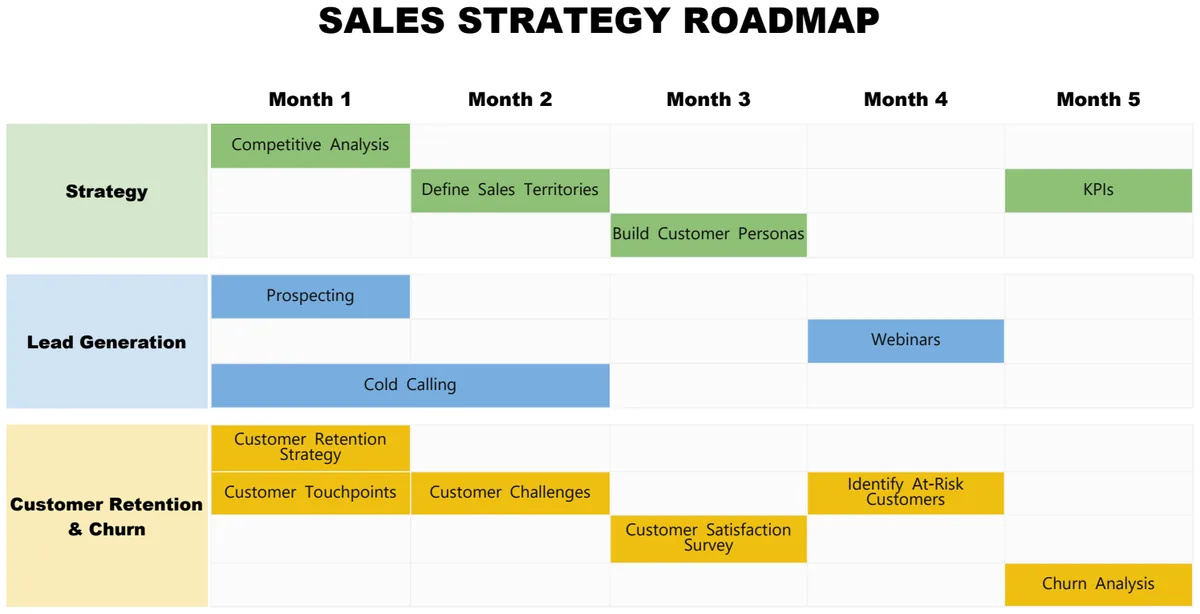
Sales Strategy Roadmap
Plan quarterly sales strategies with competitive analysis and monthly milestones.
- Monthly milestone columns
- Competitive analysis section
- Strategy development framework
 Sales & CRM
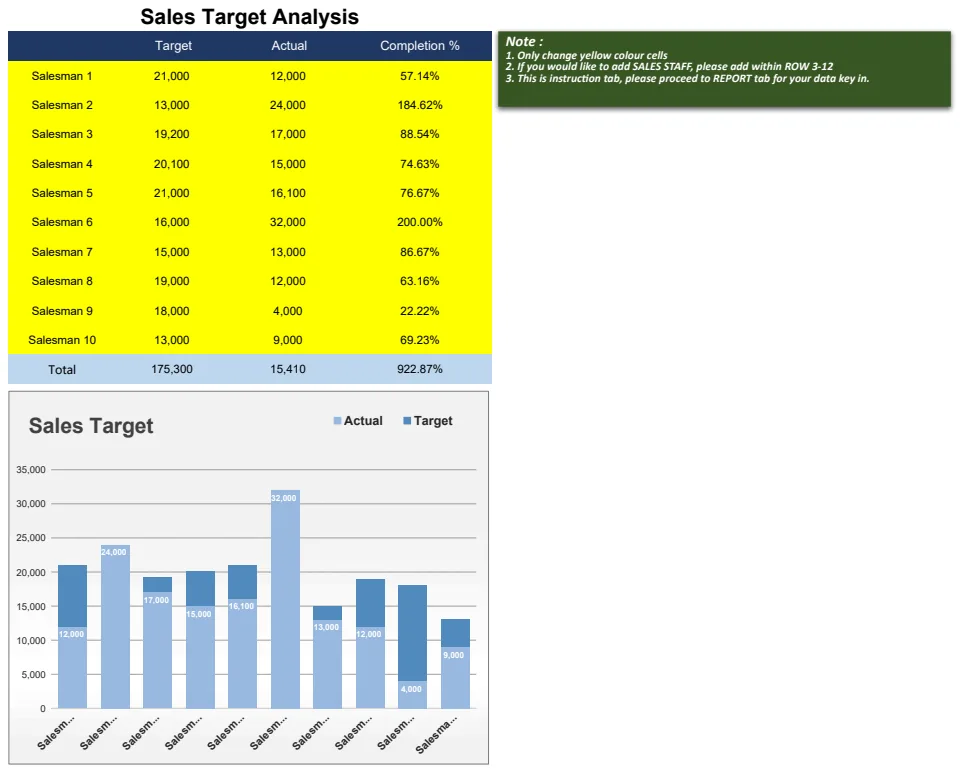
Sales Target Analysis
Track salesman performance against targets with completion percentages and variance analysis.
- Target vs Actual comparison
- Completion percentage calculation
- Sales variance analysis
 Sales & CRM
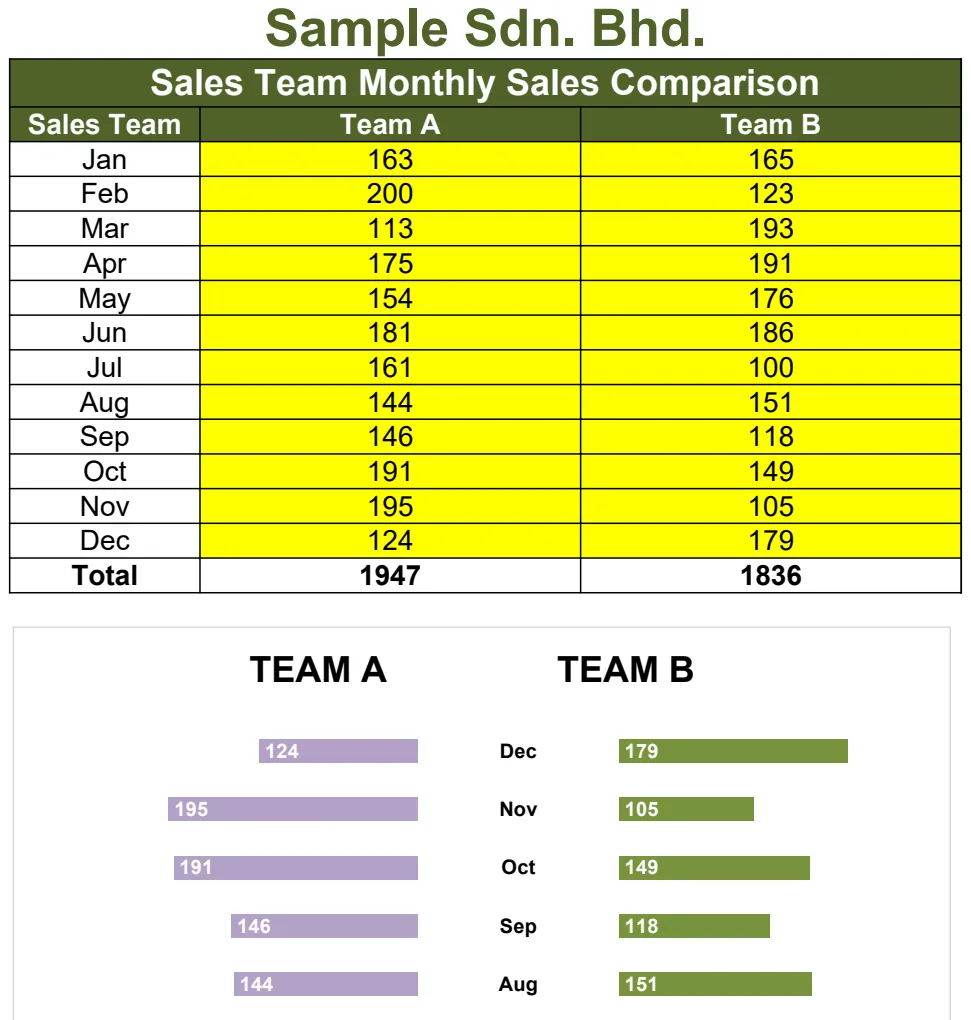
Sales Team Monthly Sales Comparison
Compare monthly sales performance across team members with visual charts and automated calculations.
- Automated SUM and AVERAGE calculations
- Visual sales comparison charts
- Multi-team performance layout
 Sales & CRM
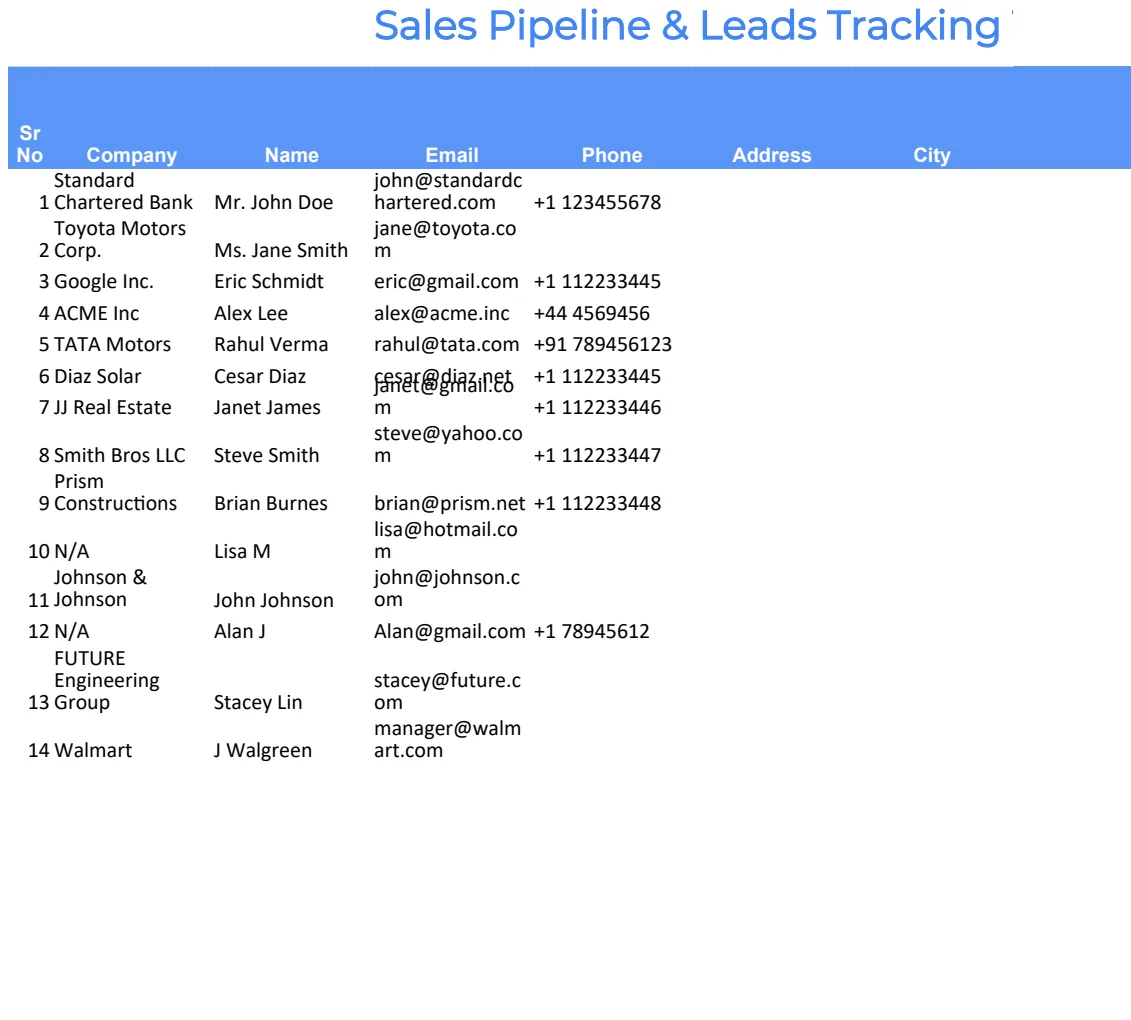
Sales Team Performance, Pipeline & Tracker
Track leads through your sales pipeline, monitor team performance, and visualize your sales funnel in one workbook.
- Sales pipeline tracking with multiple stages
- Sales funnel visualization
- Activity log with timestamps and action tracking
 Data Analysis & Visualization
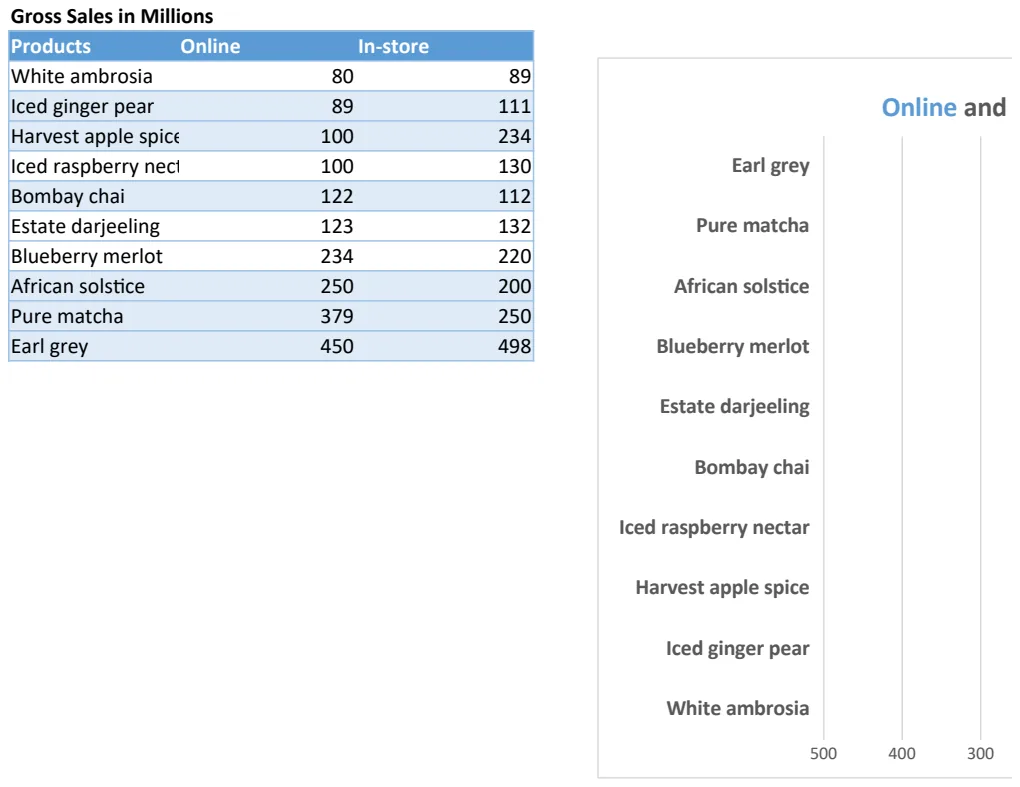
Sales Tornado Chart
Visualize sales performance across products and channels with an interactive tornado chart.
- Pre-formatted tornado chart structure
- Gross sales data by product and channel
- Online and in-store sales columns
 Sales & CRM
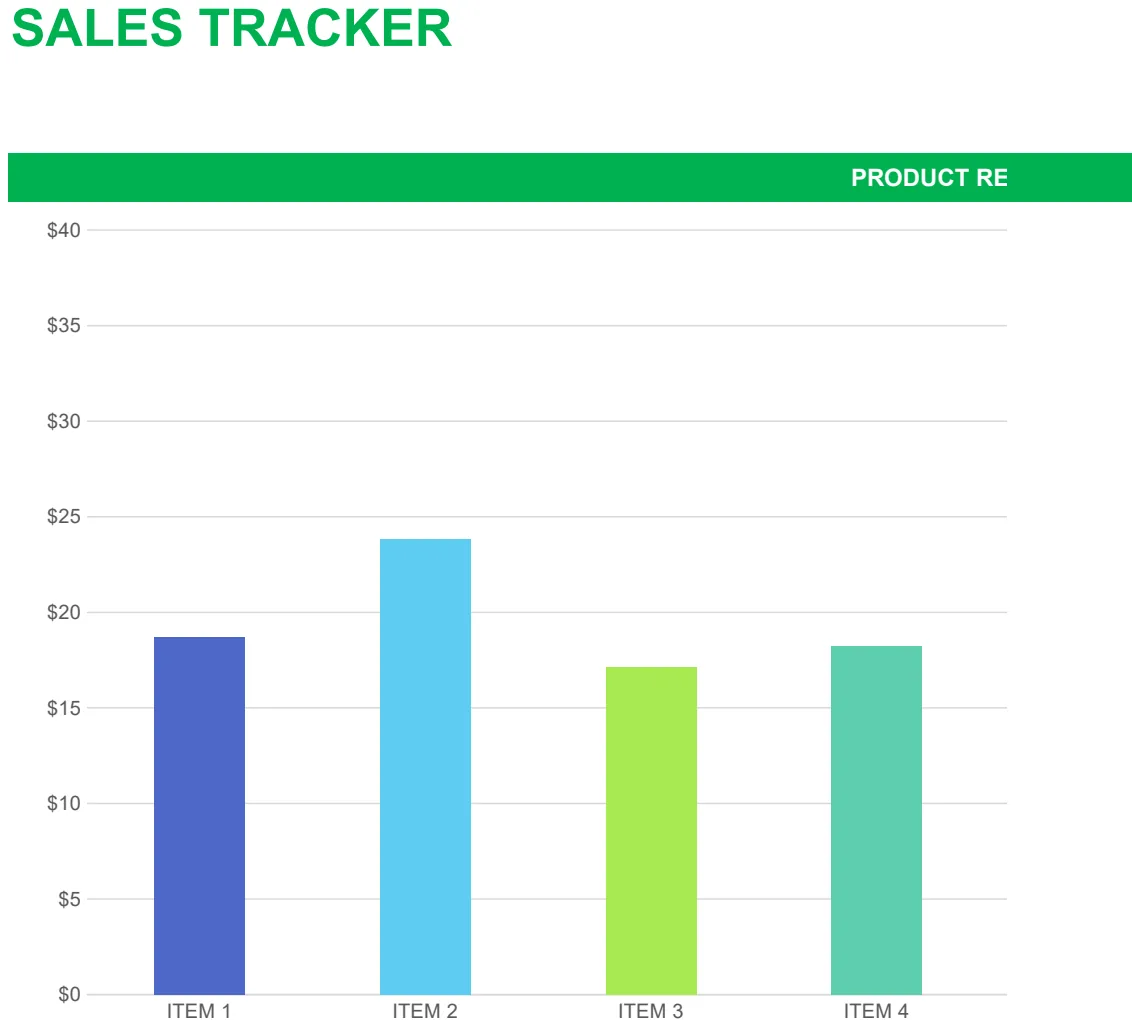
Sales Tracker & Product Sales Data
Track product sales, revenue, and profitability with automated calculations and visual charts.
- Product sales data entry with cost and markup fields
- Automated revenue and profit calculations
- Visual charts for sales and revenue trends
 Budgeting & Expense Management
Sales Training Expenses Log Template
Track sales training costs by vendor and payment method with automatic summaries and charts.
- Vendor contact directory with email and phone
- Automatic expense summaries by vendor and payment method
- Visual charts for spending analysis
 Time Tracking
Sales Travel Expense Log
Track and calculate employee travel costs with automated totals for expense reimbursement.
- Automated subtotals and totals using SUBTOTAL and SUM formulas
- Employee name and ID fields for identification
- Expense category breakdown
 Sales & CRM
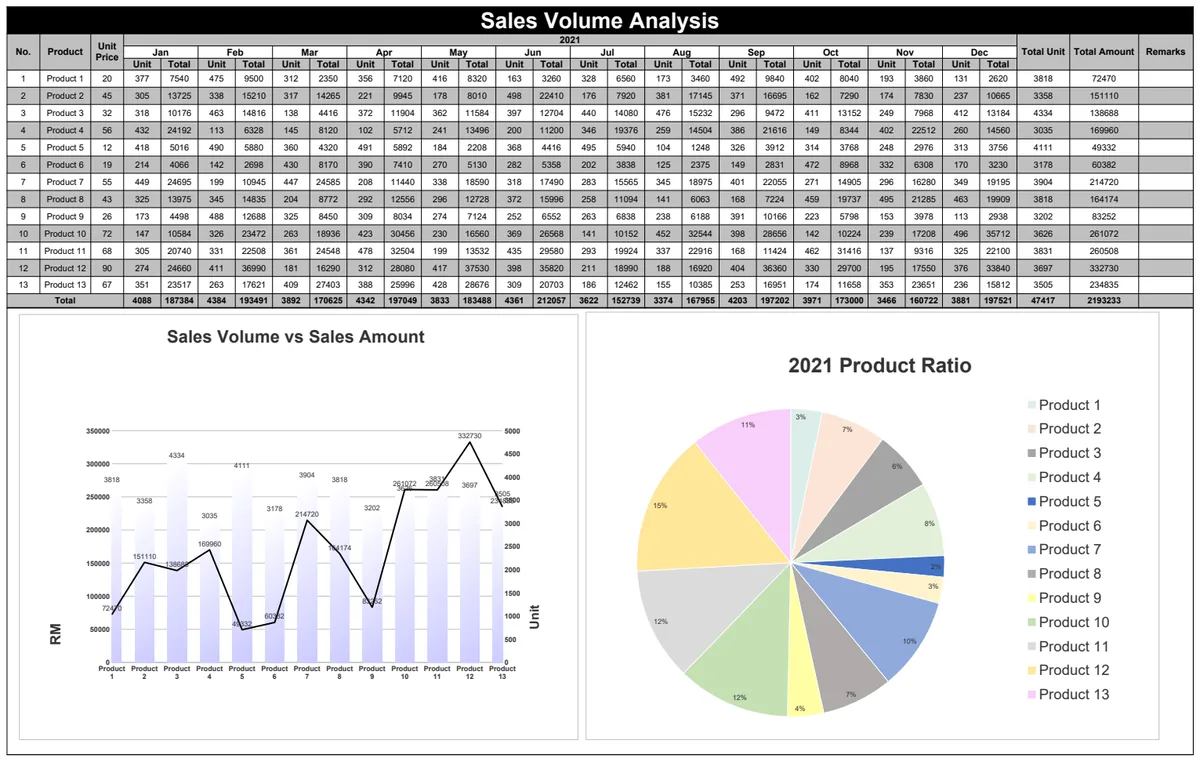
Sales Volume Analysis
Track product sales volumes and revenue by month to identify trends and top performers.
- Monthly sales volume tracking by product
- Automatic SUM calculations for total units and revenue
- Visual charts showing sales trends over time
 Sales & CRM
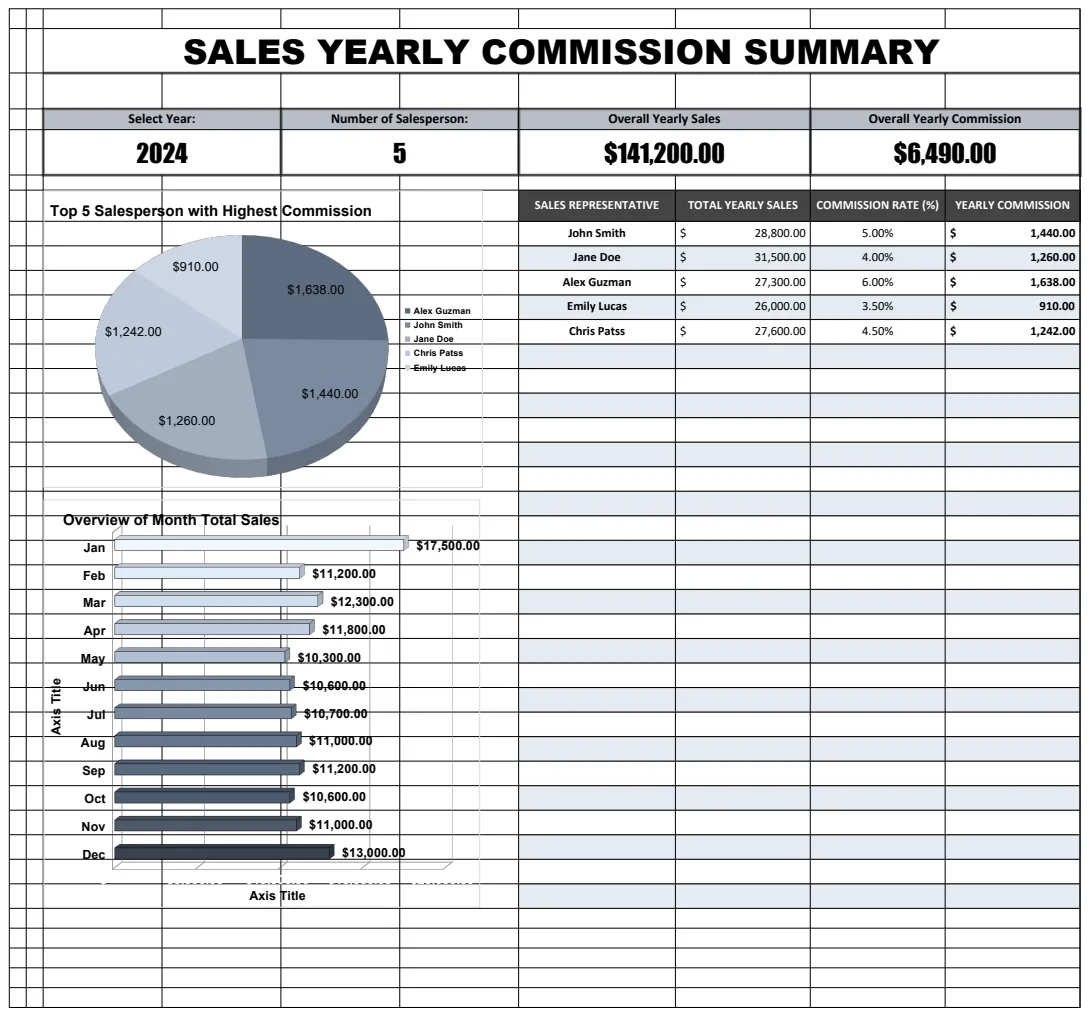
Sales Yearly Commission Summary Template
Track and summarize sales commissions across multiple salespeople throughout the year with monthly breakdowns and year-over-year comparison capabilities.
- Multiple year worksheets (2024, 2025, and blank template)
- Monthly sales tracking by individual salesperson
- Automated COUNTA function to count active salespeople
 Accounting & Bookkeeping
Salon Profit And Loss Template
A comprehensive profit and loss statement template designed specifically for salon businesses to track revenue, expenses, and profitability.
- Pre-formatted P&L structure
- Multiple sheet templates
- Revenue and expense categorization
 Project Management
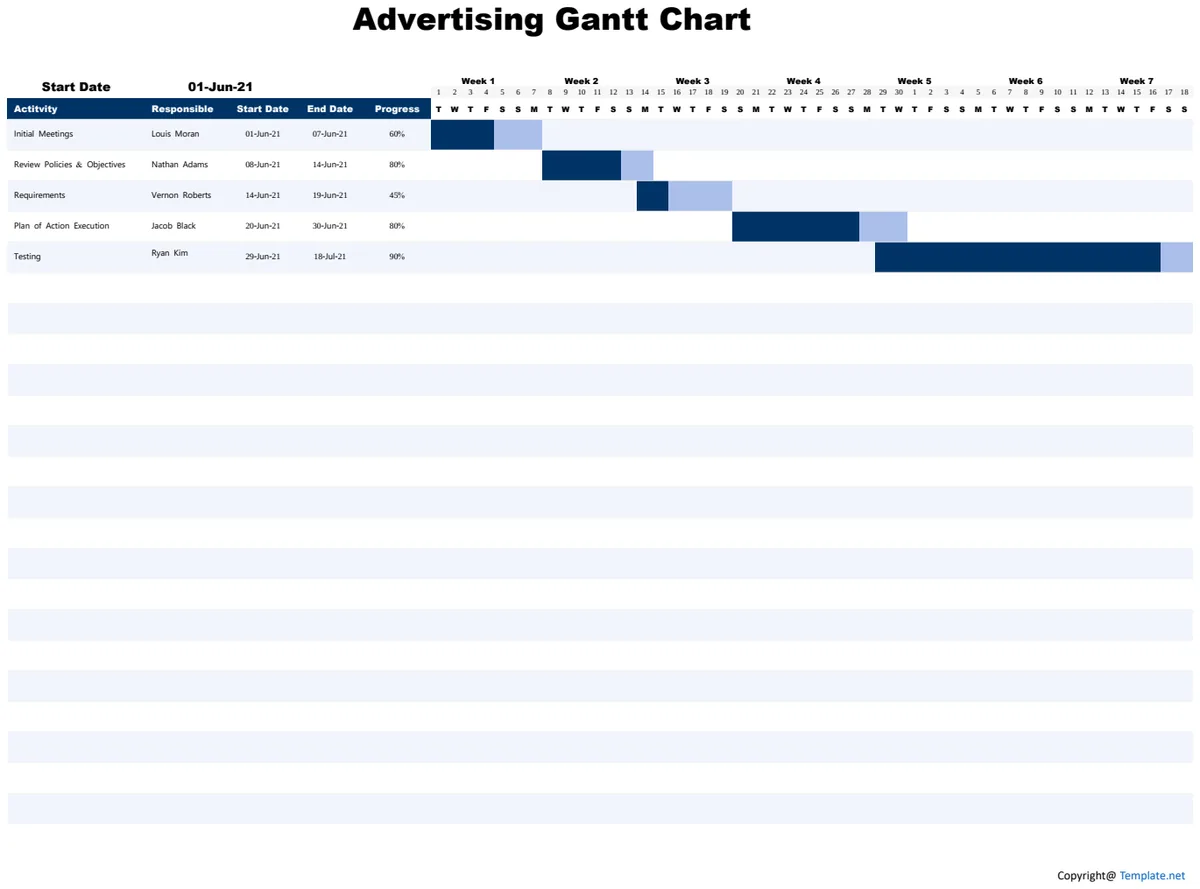
Sample Advertising Gantt Chart
Visualize advertising campaign timelines and track progress with built-in Gantt chart functionality.
- Activity name and responsible party assignment
- Start and end date tracking
- Progress percentage display
 Project Management
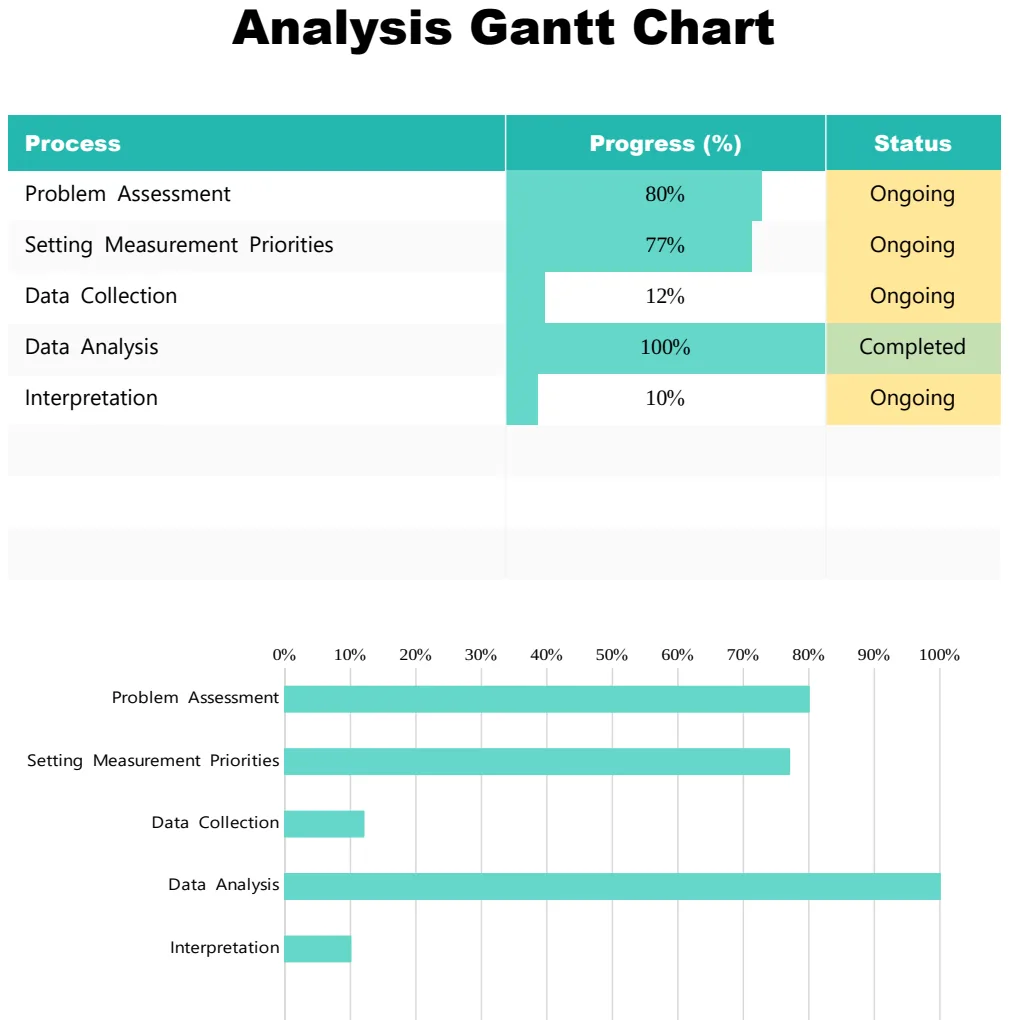
Sample Analysis Gantt Chart
Visual project timeline tracking progress across analysis phases with status indicators.
- Timeline visualization by phase
- Progress percentage tracking
- Status indicators (Ongoing, Complete, At Risk)
 Budgeting & Expense Management
Sample Church Budget Template US
Plan and track church finances with categories for tithes, offerings, salaries, and operating expenses.
- Automated SUM formulas for income and expense totals
- Visual charts for budget breakdown by category
- Sections for tithes, offerings, and donation tracking
 Data Analysis & Visualization
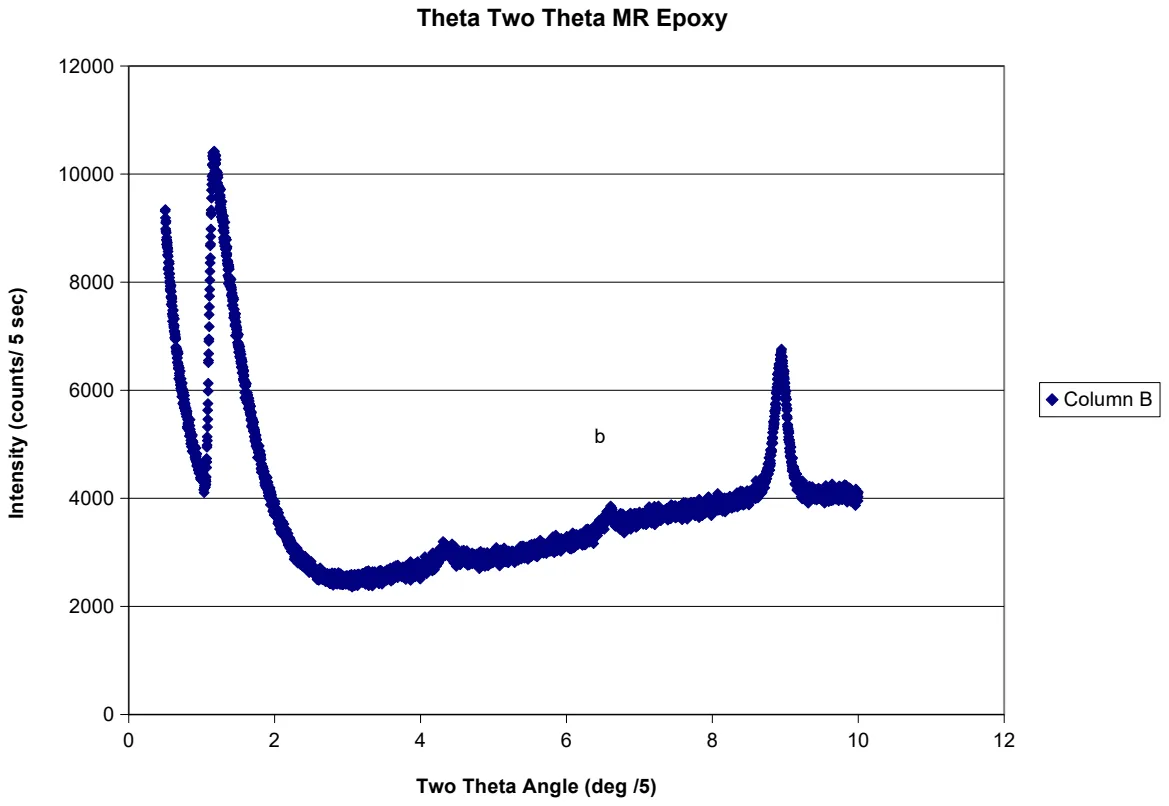
Sample Data Visualization Chart Template
Create professional charts from sample datasets with configurable data points and visual formatting.
- Pre-configured chart sheet
- Sample dataset with multiple data points
- Numerical values ready for visualization
 Project Management
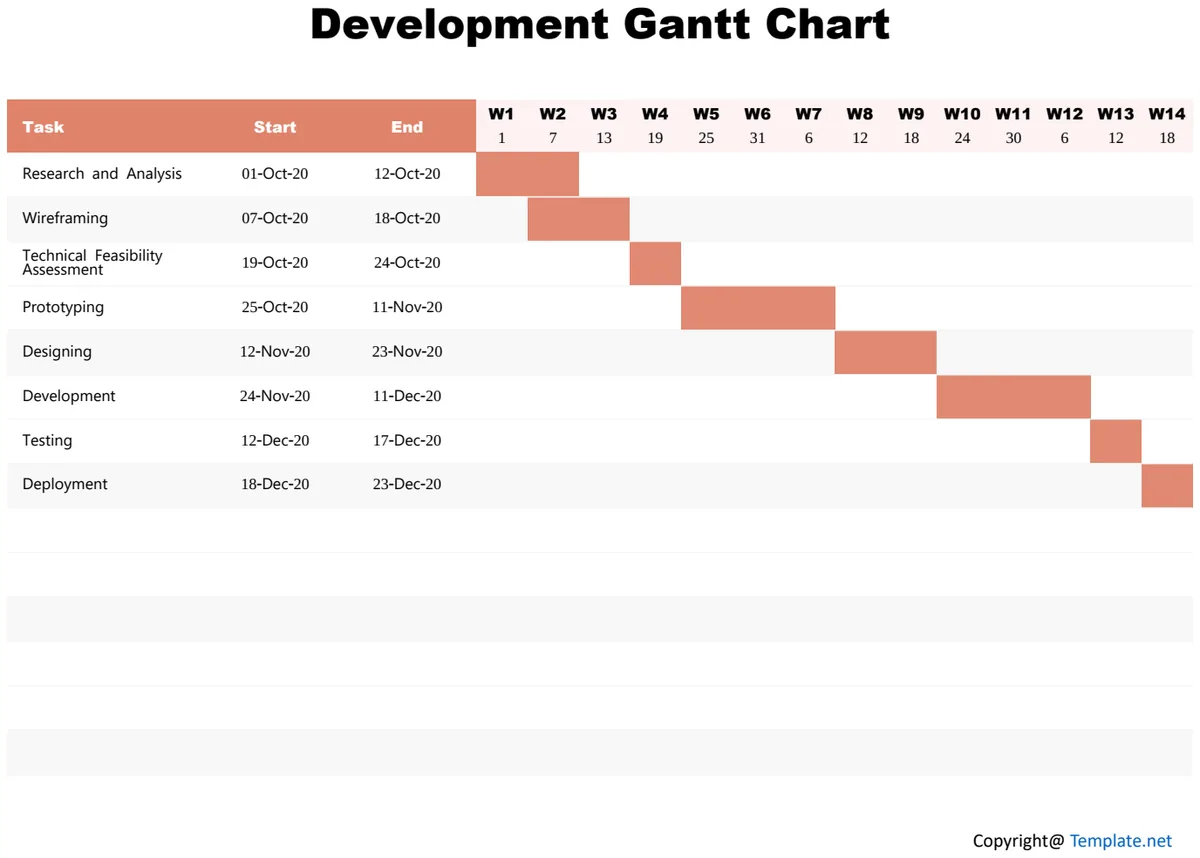
Sample Development Gantt Chart
Visual timeline for tracking development project tasks, milestones, and dependencies across weeks.
- Weekly timeline columns for granular scheduling
- Automatic date calculation (start and end dates)
- Task row structure for clear responsibility assignment
 Project Management
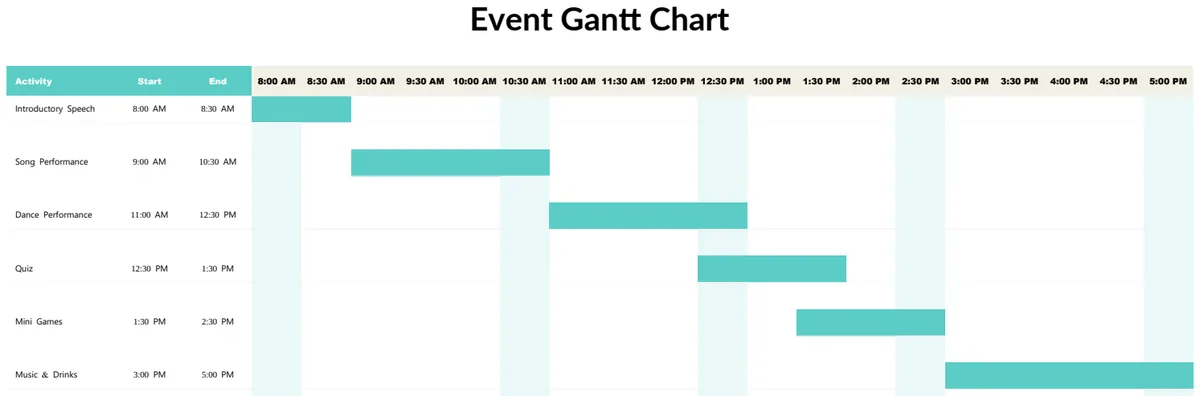
Sample Event Gantt Chart
Visualize event activities and timelines on a Gantt chart to coordinate scheduling and track progress.
- Hourly time blocks
- Activity start and end times
- Visual timeline layout
 Project Management
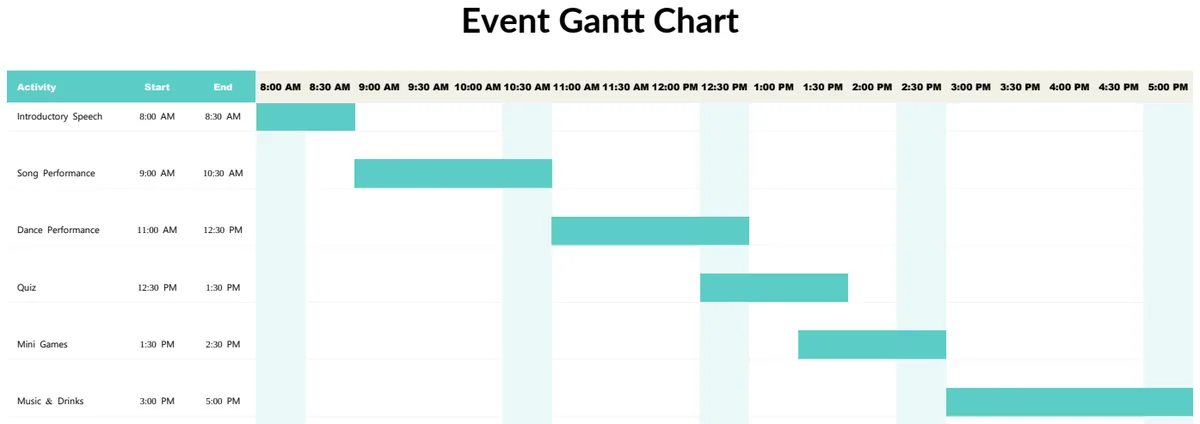
Sample Event Gantt Chart
Visual timeline for event activities with start and end times to manage scheduling and coordinate multiple tasks.
- Activity name column
- Start and end time tracking
- Visual timeline representation
 Project Management
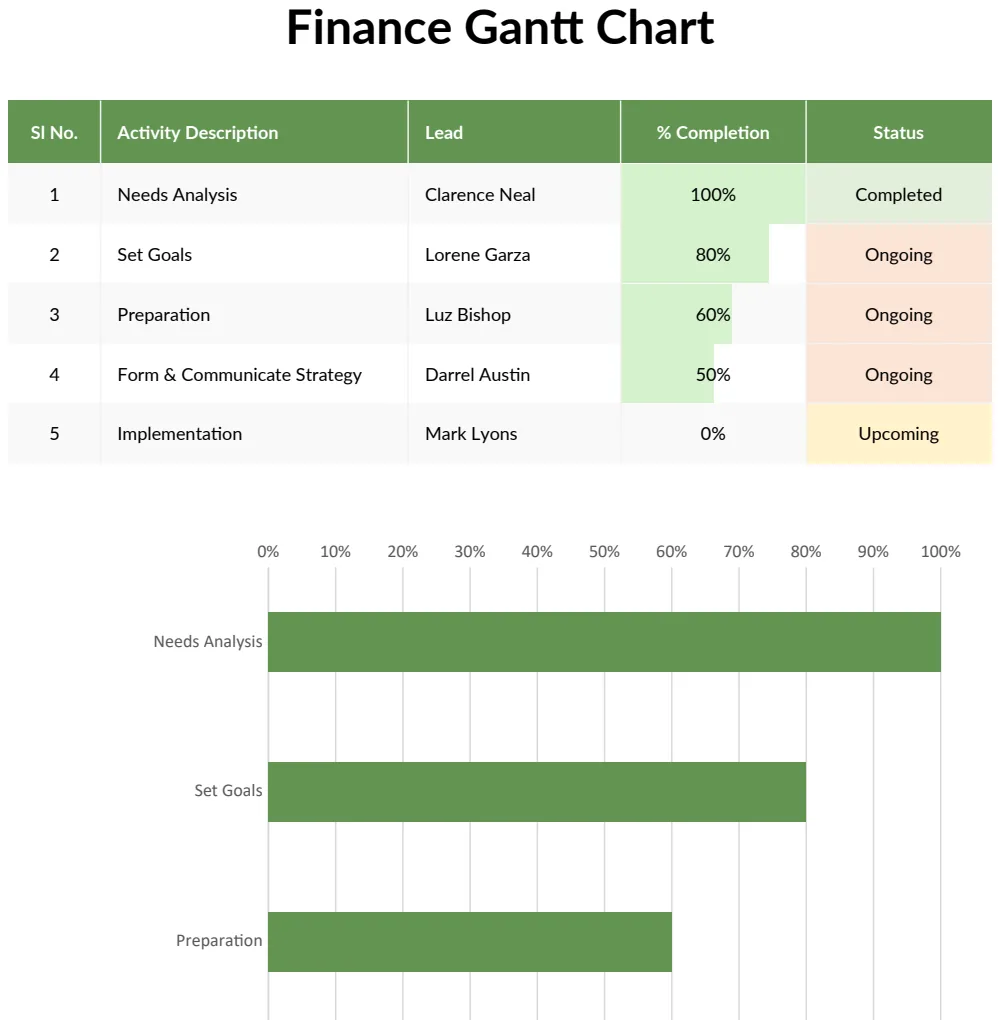
Sample Finance Gantt Chart
Track finance project milestones and timelines with completion status and task ownership.
- Activity description and sequencing
- Task owner assignment
- Percentage completion tracking