7 Best Agile Gantt Chart Templates for Project Managers in 2026
Teams often associate Gantt charts with rigid Waterfall methodologies, but their visual clarity makes them powerful tools for Agile projects in 2026. Modern Agile teams integrate Gantt charts to enhan...
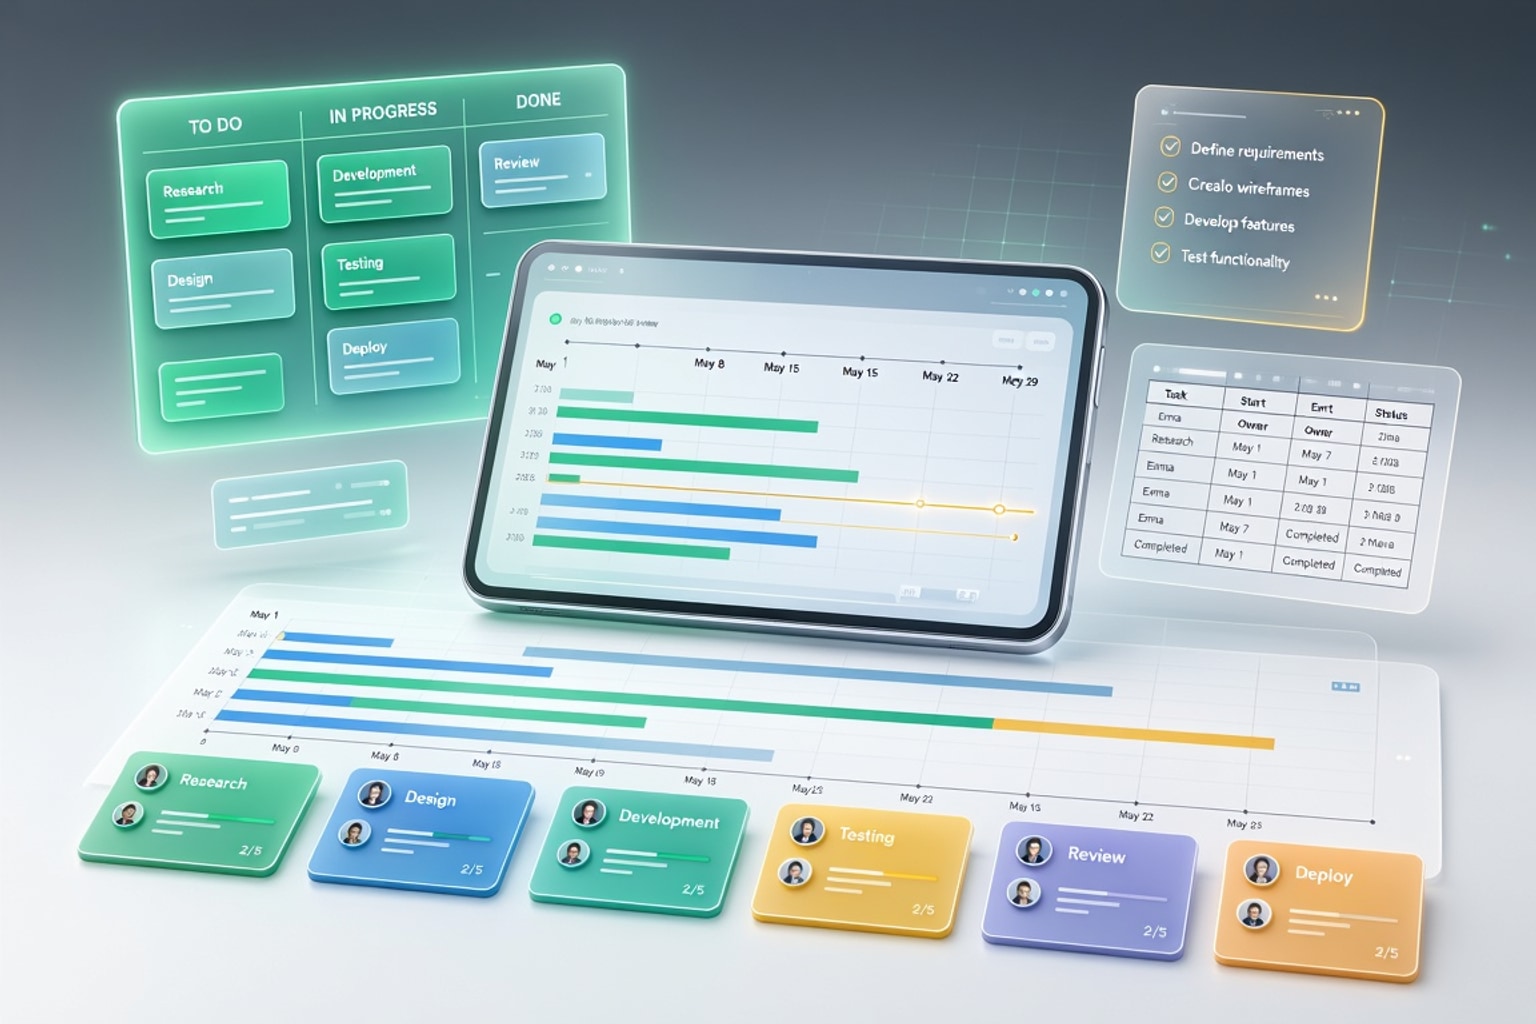
Teams often associate Gantt charts with rigid Waterfall methodologies, but their visual clarity makes them powerful tools for Agile projects in 2026. Modern Agile teams integrate Gantt charts to enhance sprint planning, manage dependencies, and communicate timelines effectively. These charts provide a transparent overview without sacrificing Agile's inherent flexibility.
Integrating Gantt Charts into Agile: 2026 Best Practices
Gantt charts offer a visual roadmap for Agile projects, complementing iterative development rather than replacing it. They help teams see the bigger picture, understand task sequences, and identify potential roadblocks. This integration supports better decision-making and more predictable sprint outcomes.
Visualizing Sprints and Iterations with Gantt Charts
Gantt charts enhance sprint planning by mapping out tasks, durations, and assignments within an iteration. Teams can quickly visualize the workload distribution and ensure realistic commitments. This visual aid helps prevent overcommitment and highlights bottlenecks before they impact the sprint.
Managing Dependencies in Agile Projects
Identifying and mitigating critical path risks becomes clearer with a Gantt chart. It visually connects dependent tasks, allowing teams to spot potential delays if one task falls behind. This proactive approach helps maintain flow and keeps the project on track.
Communicating Project Timelines to Stakeholders
Gantt charts provide clear, high-level project visibility for stakeholders who need a quick overview. They illustrate key milestones, overall project duration, and current progress without diving into daily stand-up details. This makes communication transparent and expectation setting more precise.
Top Agile Gantt Chart Software and Platforms for 2026
Several leading tools now offer robust Gantt chart capabilities tailored for Agile workflows. These platforms help teams visualize their sprints and project timelines efficiently. Choosing the right tool depends on your team's existing tech stack and specific needs.
Jira and Confluence: Enhancing Agile Workflows with Gantt Views
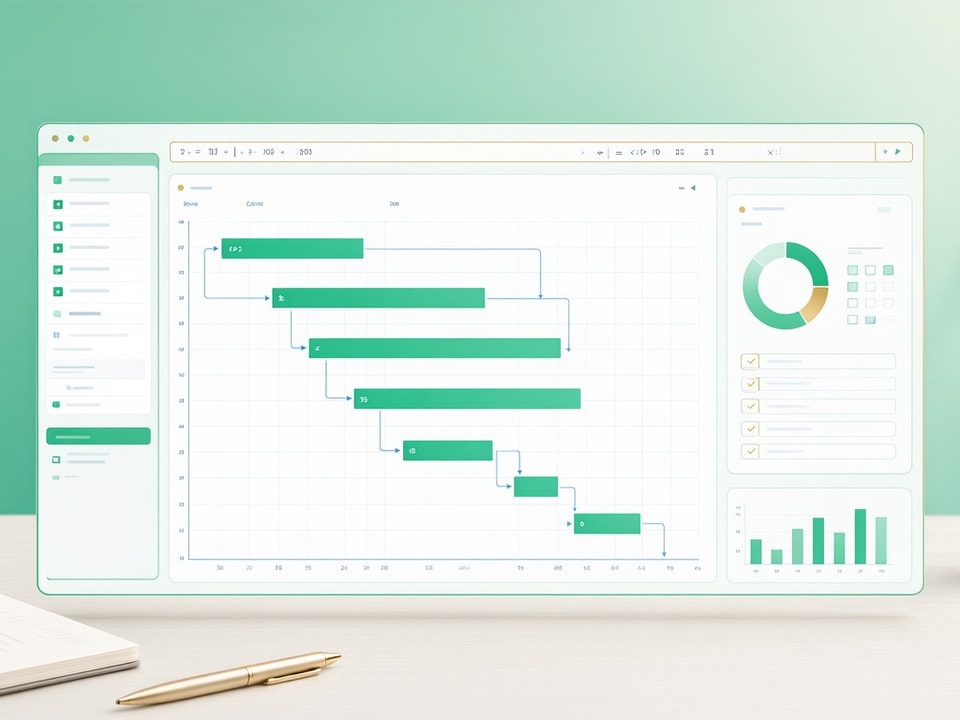
Jira, a staple for Agile teams, integrates Gantt chart views to complement Agile planning. This setup helps visualize task dependencies and timelines without forcing a Waterfall approach. It's best suited when Gantt charts serve an enhancing role, not the core planning mechanism.
Smartsheet: Dynamic Gantt Charts for Flexible Project Management
Smartsheet combines spreadsheet project tracking with powerful timeline visualization, supporting baselines and critical path analysis. Its interface feels familiar to anyone comfortable with Excel or Google Sheets, making Gantt chart creation intuitive. "Smartsheet feels familiar right away because the interface looks a lot like a spreadsheet," as one user noted.
Asana's Timeline View: A Simplified Approach to Agile Scheduling
Asana's Timeline view provides a simplified Gantt-style experience focused on task sequencing and deadlines. It offers a clear visual representation of when tasks start and end, and how they relate to each other. This feature is ideal for teams needing straightforward task orchestration.
Miro: Collaborative Agile Planning with Visual Timelines
Miro offers an Agile Project Management Plan & Gantt Chart template encompassing sprints, tasks, responsibilities, and progress status. This collaborative whiteboard allows teams to visually plan and track their Agile projects in real time. "This Agile Project Management Plan & Gantt Chart template is crafted to help teams effectively manage and visualize their agile projects," according to Miro's description.
Free and Budget-Friendly Agile Gantt Chart Templates
Not every team needs enterprise-level software. Many free and affordable options exist for creating effective Agile Gantt charts. These solutions are perfect for smaller teams or those on a tight budget.
Google Sheets Agile Gantt Chart Templates
You can set up a basic Agile Gantt chart in Google Sheets with a few simple steps. Start by listing tasks, start dates, end dates, and durations in columns. Use conditional formatting to create visual bars representing task timelines across a date range.
Microsoft Excel Agile Gantt Chart Templates
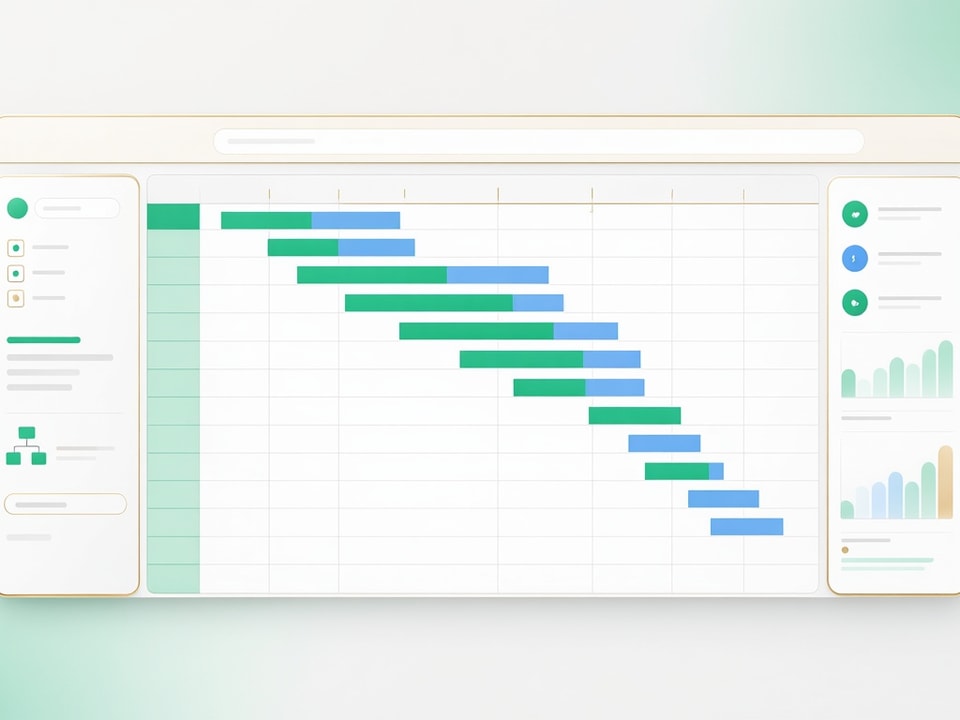
Creating a functional Gantt chart in Excel for Agile teams involves similar steps to Google Sheets. Define your tasks, assign start and end dates, and then use stacked bar charts or conditional formatting to visualize the timeline. Many free templates are available online to jumpstart this process.
TaskFord: Free Software for Essential Gantt Chart Features
TaskFord provides free Gantt chart software with essential features like task scheduling, dependencies, collaboration, and progress tracking. It's a dedicated tool offering a robust set of functionalities without the cost. This makes it an excellent choice for teams needing specialized Gantt capabilities on a budget.
Building Your Own Agile Gantt Chart: A Step-by-Step Guide
Creating a custom Agile Gantt chart in a spreadsheet gives you full control over its functionality and appearance. This approach ensures the chart perfectly matches your team's unique workflow. Follow these steps to build your own.
Defining Your Project Scope and Sprints
Start by clearly outlining your project's overall scope and breaking it down into distinct sprints. List all key tasks within each sprint, along with estimated durations and responsible team members. This initial data collection forms the backbone of your chart.
Structuring Your Spreadsheet for Agile Tasks
Set up columns for "Task Name," "Sprint," "Assigned To," "Start Date," "End Date," and "Duration (Days)." Add a column for "Progress (%)" to track completion. This structure organizes your Agile tasks logically for visualization.
Formulas for Dynamic Timelines and Progress Tracking
Use formulas to automate aspects of your Gantt chart. For example, calculate "Duration (Days)" with =DATEDIF(Start_Date, End_Date, "D"). Apply conditional formatting rules to create visual bars that extend from the "Start Date" based on the "Duration." Use sparklines or additional conditional formatting to show "Progress (%)" within each task bar.
Workflow Checklist: From Planning to Execution
Here's a quick checklist for using your custom Gantt chart:
- Define all tasks and allocate them to sprints.
- Assign start and end dates for each task.
- Link dependent tasks to visualize critical paths.
- Regularly update task progress.
- Review the chart with your team during sprint planning and reviews.
- Adjust timelines based on actual progress to keep the chart accurate.
When to Use a Template vs. Custom Build
Deciding between a pre-built template and a custom-built solution depends on your team's resources and specific requirements. Both approaches offer distinct advantages for Agile project management.
Accelerating Setup with Pre-Built Agile Gantt Chart Templates
Pre-built templates significantly reduce setup time, offering a ready-to-use structure for immediate project tracking. They often include pre-configured formulas and formatting, allowing teams to focus on project execution rather than chart creation. This is ideal for quick starts or teams with limited spreadsheet expertise.
Recommended Resources
Skip the blank-sheet setup
Start with a proven template for immediate project tracking and less error checking.
Customizing for Unique Agile Workflows
A custom build is necessary when your team has highly specific reporting needs or a unique Agile workflow. Building from scratch allows you to tailor every aspect, from data input fields to visual representations. This ensures the Gantt chart perfectly aligns with your team's existing processes and tools.
The Openworksheet Spreadsheet Templates Mega Library
For those seeking a comprehensive solution, the Thousands of Spreadsheet Templates Mega Library offers lifetime access to a vast collection of Google Sheets and Excel templates. This resource provides pre-built structures for various project management needs, including Agile Gantt charts, saving you significant setup time and effort.
Common Mistakes to Avoid with Agile Gantt Charts
While powerful, Gantt charts can become counterproductive if used incorrectly within an Agile framework. Awareness of common pitfalls helps maintain their effectiveness. Avoid these mistakes to keep your charts truly Agile.
Over-Detailing and Micro-Management
An Agile Gantt chart should provide an overview, not a microscopic daily schedule. Over-detailing tasks can lead to micro-management, stifling team autonomy and Agile's adaptive nature. Focus on key milestones and sprint-level tasks.
Ignoring Team Feedback and Adaptability
The chart should serve the team, not the other way around. Regularly solicit feedback from your team on the chart's usability and accuracy. Agile is about adaptability, so be prepared to adjust your Gantt chart as project priorities or realities shift.
Stale Data: Keeping Your Gantt Chart Current
A Gantt chart with stale data is misleading and useless. Implement a routine for updating progress, task changes, and new dependencies. "Adjust timelines based on actual progress, resource allocation, and task completion as the project advances to ensure the Gantt chart remains accurate and relevant."
Future-Proofing Your Agile Gantt Charts with AI and Automation
The future of Agile Gantt charts lies in leveraging AI and automation to enhance their utility and reduce manual effort. These technologies are transforming how teams plan and track projects. Embrace these advancements to make your charts even more powerful.
AI-Powered Dependency Analysis and Risk Prediction
AI can analyze complex task dependencies and predict potential risks or delays before they occur. It can identify patterns in past project data to offer insights into more accurate task estimations. This proactive intelligence helps project managers mitigate issues early.
Automating Progress Updates and Reporting
Integrate your Gantt chart with other project management tools to automate progress updates. Tools can automatically pull task completion percentages or status changes, reducing manual data entry. This streamlines reporting and ensures the chart always reflects the latest project status.
Get the newsletter
One sharp idea every Sunday.
No fluff. No sales pitches. Just the best of what we publish, hand-picked.
Continue Reading
Related Articles
20+ Free Excel Project Management Templates (2026)
Project management in 2026 demands efficiency and clear oversight. Free Excel templates offer a powerful, cost-effective solution for tracking tasks, managing budgets, and hitting deadlines. You can a...

10+ Best Pre-Construction Estimator Templates & Software (2026)
A single miscalculated line item can turn a profitable project into a six-month nightmare. Contractors lose bids because their estimates run too high, or win them and bleed margin because critical cos...
Automate Freelance Onboarding: 7 Google Sheets Strategies
Freelancers often juggle client work, marketing, and administrative tasks. Manual client onboarding adds unnecessary friction, turning what should be an exciting start into a tedious chore. This ineff...