Most small business owners can read a bank statement and a sales report, yet the three financial statements stay a mystery until a lender, an investor or an accountant asks for them. Then the scramble starts: a profit and loss from one file, a balance sheet from another, a cash flow statement that nobody can reconcile, and a balance sheet that is out by a few hundred that nobody can find.
The reason is simple. The three statements are not separate documents. They are three views of the same transactions, and they only agree if they are built from one source. This guide shows the standard balance sheet format, how it links to the income statement and the cash flow statement, how to build all three in Excel from a single trial balance, and a full worked example that balances to the dollar.
The balance sheet format
A balance sheet is a snapshot of what a business owns and owes on one date. It rests on one equation:
Assets = Liabilities + Equity
The standard layout lists assets first, then liabilities, then equity, and splits assets and liabilities into current (due or usable within 12 months) and non-current:
- Current assets: cash and bank, trade receivables, inventory, prepayments
- Non-current assets: property, plant and equipment at cost, less accumulated depreciation, plus intangibles and long-term investments
- Current liabilities: trade payables, accruals, tax payable, the part of loans due within a year
- Non-current liabilities: long-term borrowings and other long-term obligations
- Equity: share capital, retained earnings brought forward, profit for the year and dividends or drawings
Many people prefer the version that shows net assets (total assets less total liabilities) and then equity, because the two must be equal and a single check row proves it.
The income statement format
The income statement (profit and loss) covers a period, not a date. It runs from the top line down to the bottom line:
- Revenue
- Cost of sales, giving gross profit
- Operating expenses: salaries, rent, marketing, administration, software and so on
- EBITDA: profit before depreciation, amortisation, interest and tax
- Depreciation and amortisation, giving operating profit (EBIT)
- Finance costs, giving profit before tax
- Income tax, giving net profit
Show a margin beside each profit line (gross, EBITDA, operating and net margin) and a prior year column. A statement without comparatives tells you what happened but not whether it was good.
How the three statements link
This is the part that most hand-built workbooks get wrong, so it is worth stating plainly:
- 01Net profit from the income statement is added to equity on the balance sheet. If it is missing, the balance sheet will never balance.
- 02Depreciation reduces assets on the balance sheet and is an expense on the income statement, but no cash leaves the business. The cash flow statement adds it back.
- 03The cash flow statement starts from net profit and explains the change in the cash line between two balance sheets. If it does not land exactly on the balance sheet cash, something is wrong.
Change one number, such as a larger receivable, and it moves all three: profit is unchanged, the asset rises, and operating cash flow falls by the same amount.
A worked example that balances
A fictional small distributor starts the year with this balance sheet.
| Opening balance sheet | 31 Dec |
|---|---|
| Cash | 20,000 |
| Receivables | 15,000 |
| Inventory | 10,000 |
| Equipment (net) | 40,000 |
| Total assets | 85,000 |
| Payables | 12,000 |
| Loan | 28,000 |
| Total liabilities | 40,000 |
| Equity | 45,000 |
Assets of 85,000 equal liabilities of 40,000 plus equity of 45,000. Now the year's income statement:
| Income statement | Year |
|---|---|
| Revenue | 200,000 |
| Cost of sales | 90,000 |
| Gross profit | 110,000 |
| Operating expenses | 60,000 |
| Depreciation | 10,000 |
| Operating profit (EBIT) | 40,000 |
| Interest | 3,000 |
| Profit before tax | 37,000 |
| Tax (20 percent) | 7,400 |
| Net profit | 29,600 |
During the year the business also buys 15,000 of equipment, repays 4,000 of the loan, pays 5,000 of the tax and pays 8,000 in dividends. Receivables grow by 6,000, inventory by 3,000 and payables by 3,000. The unpaid 2,400 of tax becomes a liability.
Cash flow statement (indirect method)
| Cash flow | Year |
|---|---|
| Net profit | 29,600 |
| Add back depreciation | 10,000 |
| Increase in receivables | -6,000 |
| Increase in inventory | -3,000 |
| Increase in payables | 3,000 |
| Increase in tax payable | 2,400 |
| Operating cash flow | 36,000 |
| Purchase of equipment | -15,000 |
| Loan repayment | -4,000 |
| Dividends paid | -8,000 |
| Net change in cash | 9,000 |
Opening cash of 20,000 plus 9,000 gives closing cash of 29,000. Now the closing balance sheet:
| Closing balance sheet | 31 Dec |
|---|---|
| Cash | 29,000 |
| Receivables | 21,000 |
| Inventory | 13,000 |
| Equipment (net, 40,000 + 15,000 - 10,000) | 45,000 |
| Total assets | 108,000 |
| Payables | 15,000 |
| Tax payable | 2,400 |
| Loan (28,000 - 4,000) | 24,000 |
| Total liabilities | 41,400 |
| Equity (45,000 + 29,600 - 8,000) | 66,600 |
Liabilities of 41,400 plus equity of 66,600 equal 108,000, the same as total assets. All three statements agree, because every number came from the same movements.
Ratios worth tracking every month
With the statements in place, a few ratios turn them into signals. From the example:
- Gross margin: 110,000 / 200,000 = 55 percent
- Net margin: 29,600 / 200,000 = 14.8 percent
- Current ratio: current assets 63,000 / current liabilities 17,400 = 3.6
- Quick ratio: (cash + receivables) 50,000 / 17,400 = 2.9
- Debt to equity: borrowings 24,000 / equity 66,600 = 0.36
- Interest cover: operating profit 40,000 / interest 3,000 = 13.3 times
- Receivable days: 21,000 / 200,000 x 365 = 38 days
Read them as a set. A healthy margin with rising receivable days means profit is turning into customer debt rather than cash. A strong current ratio with falling cash can mean the money is sitting in inventory.
How to build it in Excel
The method that keeps the statements consistent is to enter data once and let every statement read from it.
1. A trial balance. One row per account with its balance, debits positive and credits negative, as most accounting software exports it. Add a column that maps each account to a statement line, for example "Rent" maps to "Rent and occupancy".
2. SUMIFS to build each line. Each statement line is a SUMIFS of the trial balance by its mapping:
=SUMIFS(Balance, Line, "Revenue")
3. Profit into equity. Equity includes profit for the year to date, pulled from the income statement, so the balance sheet reacts when the income statement changes.
4. A check row. =TotalAssets - TotalLiabilities - TotalEquity must be zero. Put it where you cannot miss it.
5. Cash flow from balance sheet changes. Each working capital line is this month's balance less last month's, with the sign flipped for assets:
=-(Receivables_now - Receivables_prior)
6. A cash reconciliation. Opening cash plus the net change in cash must equal the closing cash on the balance sheet.
Do this for every month and the workbook becomes a monthly reporting tool rather than a year-end exercise.
Why balance sheets do not balance
When the check row is not zero, the cause is almost always one of these:
- The trial balance does not total zero, often from a pasted export with a missing line.
- An account is not mapped to any statement line, so it drops out.
- Profit is double counted or missing from equity.
- Depreciation was booked on one side only.
- The sign of a credit balance was flipped during a paste.
- Prior year balances changed after the year was closed.
Check the trial balance total first. If it is zero, look for unmapped accounts.
Mistakes that make financial statements unreliable
- Typing numbers into each statement instead of building them from one source.
- No prior year or budget comparison.
- Mixing cash and accrual, so profit and cash cannot be reconciled.
- Burying owner drawings in expenses.
- Never reconciling cash to the bank.
- Presenting figures without a date or period.
- Ignoring the cash flow statement. Profit alone says little about whether you can pay the bills.
All three statements in one workbook
You can build this yourself, but linking the trial balance, three monthly statements, comparatives, ratios and checks without breaking a reference takes many hours. The Financial Statements Pack does it from one trial balance.
List your accounts on the Trial Balance tab, map each to a statement line and enter the opening balances and each month. You can paste closing balances from your accounting software or enter monthly movements. The Income Statement shows each month of the fiscal year with margins, the year to date, the prior year and each line as a share of revenue. The Balance Sheet shows the prior year end and every month end, adds profit to equity automatically and checks that net assets equal equity.
The Cash Flow Statement uses the indirect method and reconciles to the cash on the balance sheet every month. The Financial Statements tab puts all three on one printable page, and Ratios tracks 16 ratios by month, from margins and returns to current ratio, interest cover, receivable, inventory and payable days and the cash conversion cycle. The Dashboard shows revenue, profit, cash and the current ratio, with charts and five data checks. Statement labels can be renamed, the fiscal year can start in any month and the pack holds 300 accounts. It locks the formulas without a password and contains no macros.
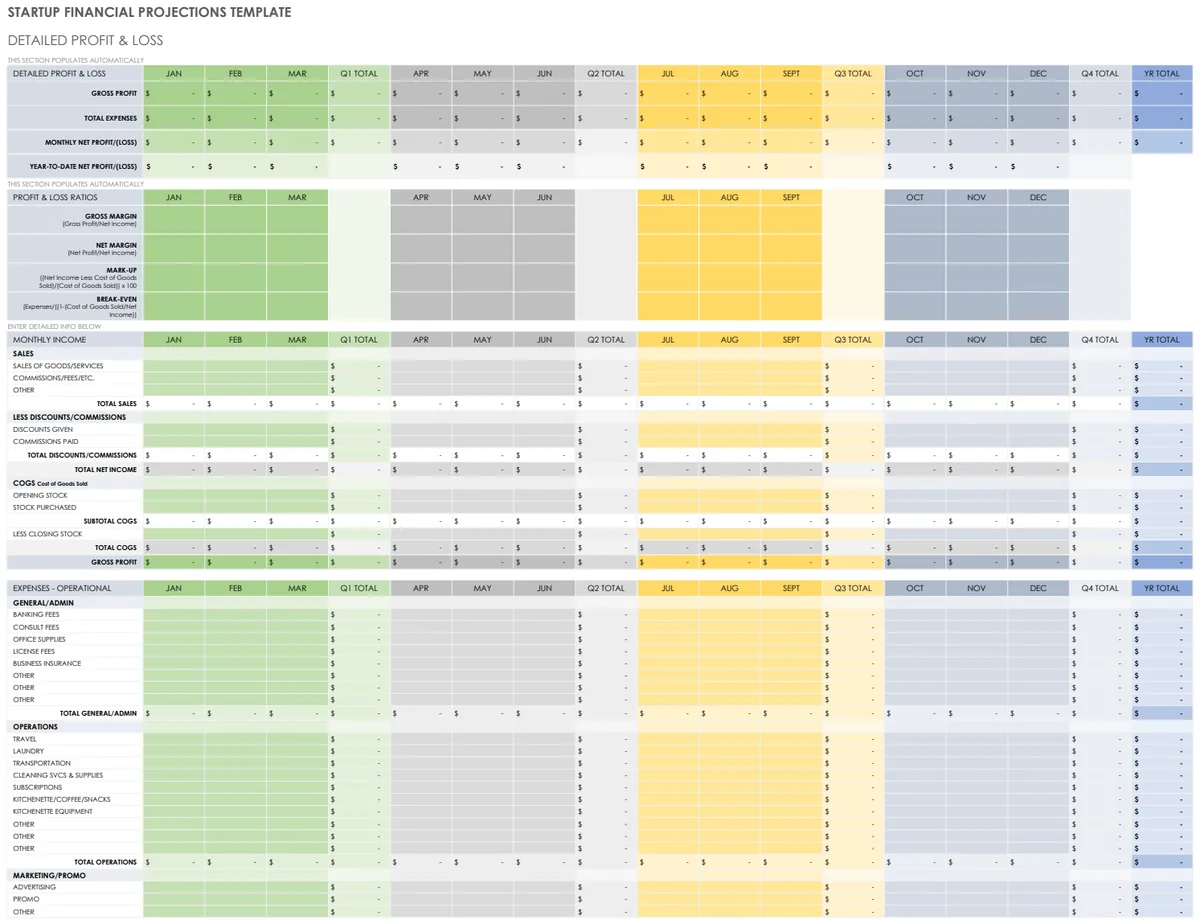
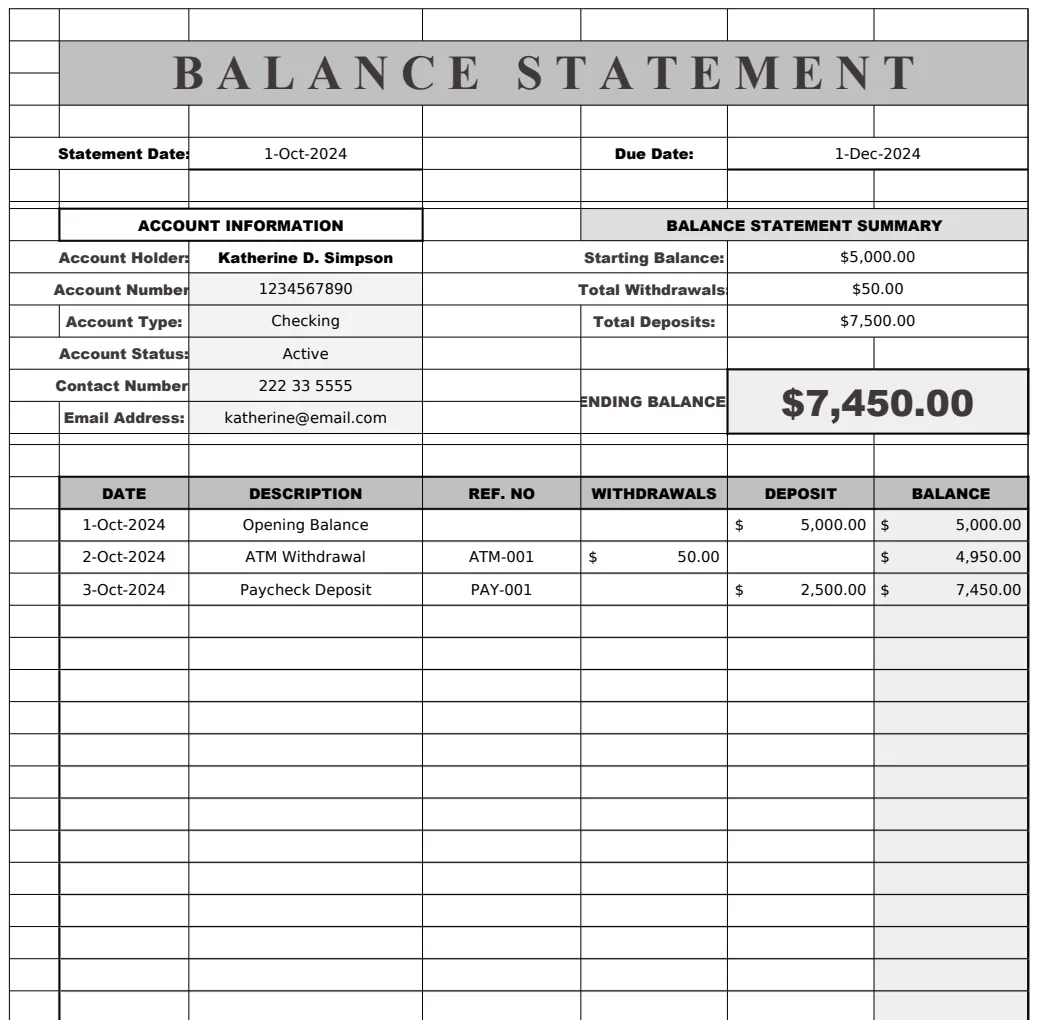
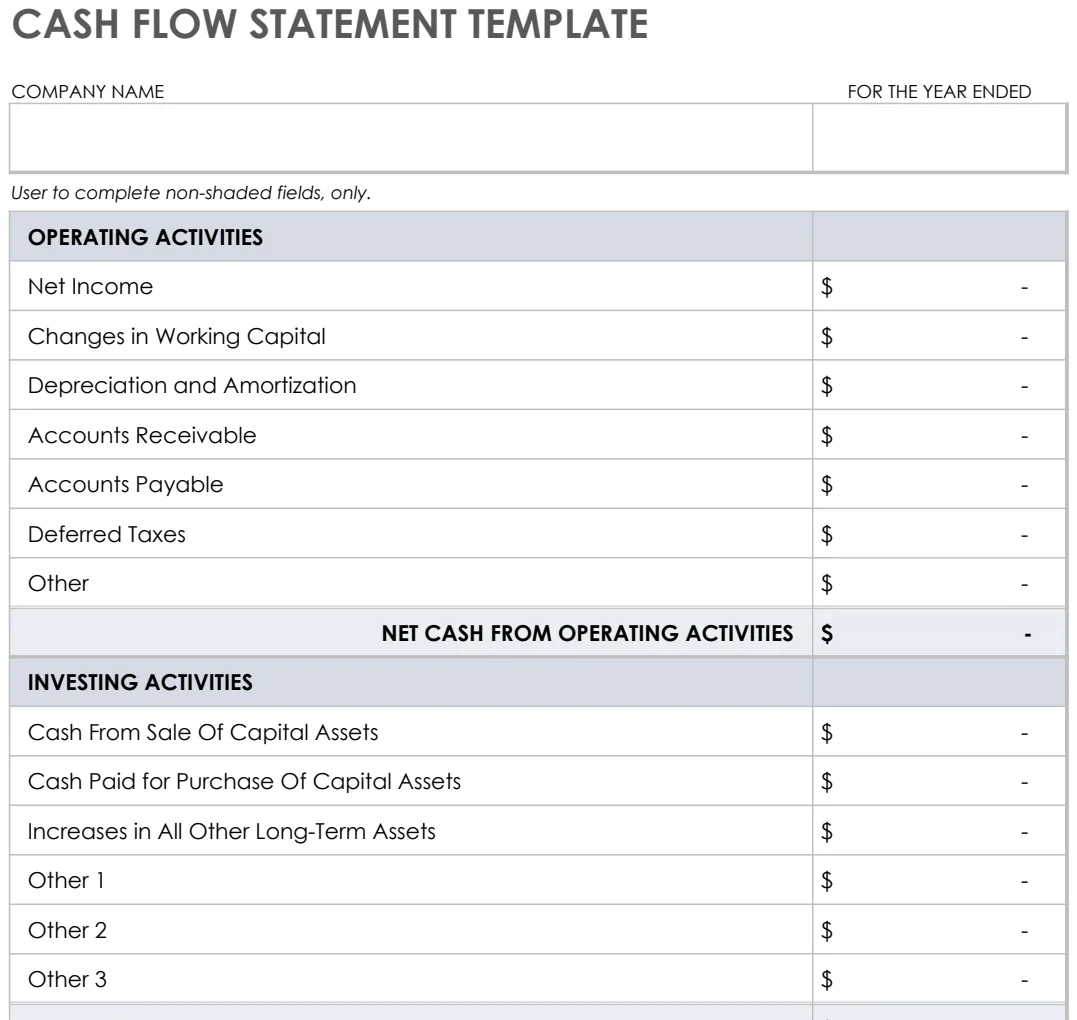
For simpler needs, these templates may be enough:
Common questions
What is the format of a balance sheet?
Assets come first, split into current and non-current, then liabilities split the same way, then equity. Total assets equal total liabilities plus equity, and a good template checks that every month.
How do I make a balance sheet in Excel?
Keep a trial balance with each account mapped to a statement line, build each line with SUMIFS, pull profit for the year into equity and add a check row that must equal zero. A template does the linking for you.
How are the three financial statements linked?
Net profit from the income statement is added to equity on the balance sheet. The cash flow statement starts from net profit and explains the change in cash between two balance sheets.
What is the indirect cash flow method?
It starts with net profit, adds back non-cash costs such as depreciation, adjusts for changes in receivables, inventory and payables, then adds investing and financing cash flows.
Why does my balance sheet not balance?
Usually the trial balance does not total zero, an account is not mapped to a line or profit is missing from equity. Check the trial balance total first.
Does it work in Google Sheets?
The workbook is built for Microsoft Excel 2016 or later (desktop or Excel for the web). You can import it into Google Sheets, but sheet protection does not carry over, so the locked formulas are easier to overwrite there by accident.
Financial statements that agree with each other are the foundation for every conversation about money, from a bank loan to a budget. You can preview the Financial Statements Pack free; downloading it is included in the OpenWorksheet monthly plan, along with the rest of the library. All figures in this guide are examples for a fictional business, and this is general information rather than accounting advice.