Excel vs. Sheets: Which P&L template wins for small business?
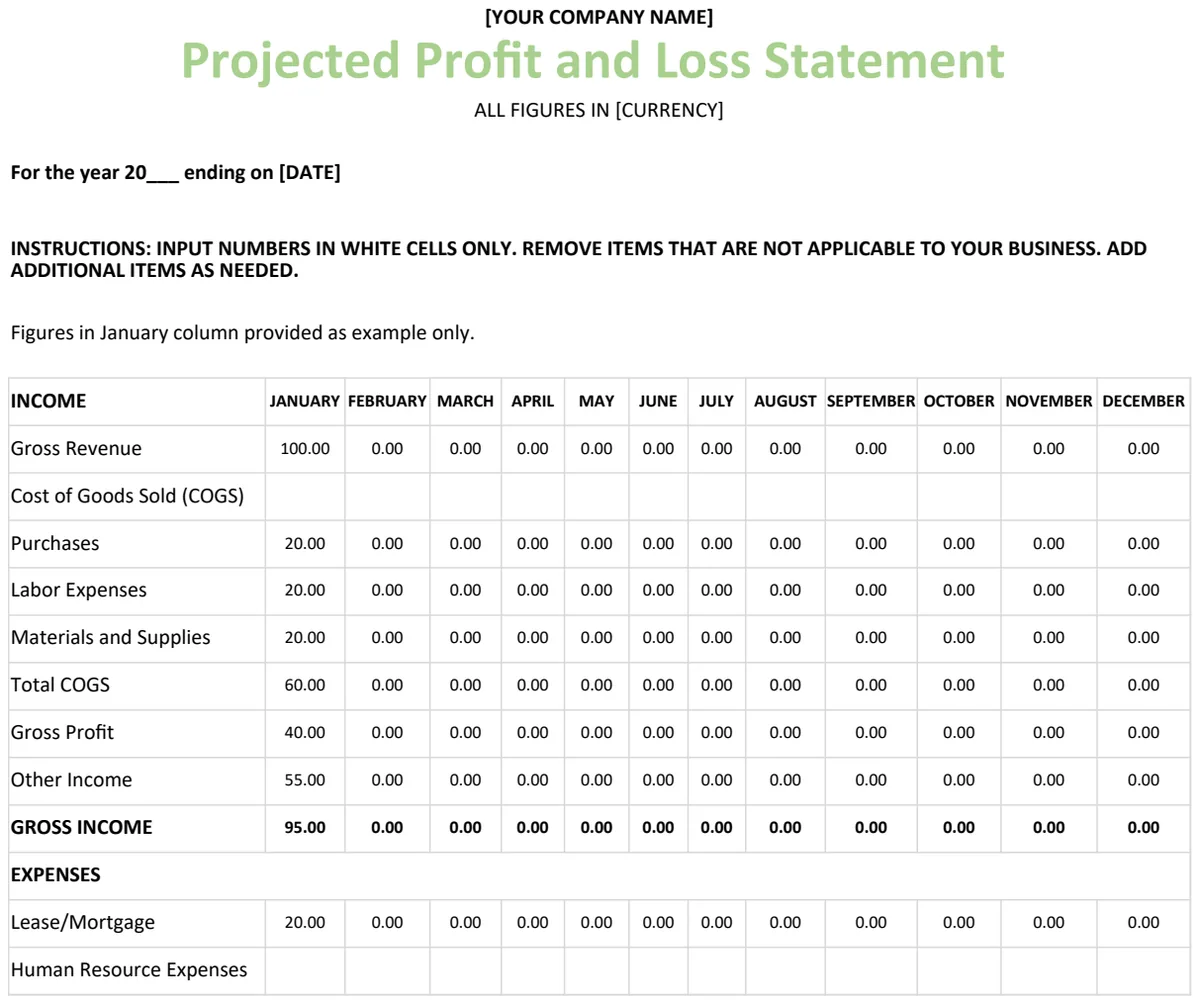
Choosing the right profit and loss statement template is key. We compare Excel and Sheets to help your small business understand its finances better.
The most common mistake when setting up a profit and loss statement template Excel is miscategorizing expenses, often by lumping variable costs with fixed costs, which obscures true profitability drivers. A well-structured P&L statement should clearly delineate between Cost of Goods Sold (COGS), operating expenses, and other income or expenses. This clarity is crucial for understanding where your money is going and how to improve your bottom line.
Getting this structure right from the start saves immense time and prevents confusion down the line. Many templates are too simplistic, failing to provide the granular detail needed for effective financial analysis. We'll walk through building a functional profit and loss statement template in Excel that addresses these common pitfalls, offering a solid foundation for tracking your business's financial performance. This isn't just about having a document; it's about creating a tool that actively informs your business decisions.
Understanding the Core Components of a P&L
A profit and loss statement, also known as an income statement, is fundamentally about tracking revenue and expenses over a specific period. The goal is to arrive at your net profit or loss. The key sections, in order, are:
- 01Revenue: This is the total income generated from your primary business activities. For a retail business, this is sales of goods. For a service business, it's fees for services rendered.
- 02Cost of Goods Sold (COGS): This includes the direct costs attributable to the production or purchase of the goods sold by a company. For a retailer, this is the cost of buying the inventory. For a manufacturer, it's the cost of raw materials and direct labor. Services generally don't have COGS, or it's minimal.
- 03Gross Profit: Calculated as Revenue minus COGS. This tells you how efficiently you are producing or acquiring your products or services.
- 04Operating Expenses (OpEx): These are the indirect costs of running your business, not directly tied to producing a specific product or service. Common examples include rent, salaries (for non-production staff), utilities, marketing, insurance, and office supplies.
- 05Operating Income (or Loss): This is your Gross Profit minus your Operating Expenses. It shows the profitability of your core business operations before considering interest and taxes.
- 06Other Income and Expenses: This section captures items not related to your main business operations. Examples include interest income, interest expense, gains or losses on asset sales, and one-time charges.
- 07Income Before Tax: Operating Income adjusted for Other Income and Expenses.
- 08Income Tax Expense: The amount of tax your business owes.
- 09Net Income (or Loss): The final figure, your profit after all expenses and taxes have been accounted for.
Structuring Your Excel Profit and Loss Statement Template
To create a robust profit and loss statement template Excel, you need a clear, organized structure. We'll set this up with specific columns for different periods, allowing for easy comparison.
Let's assume you want to track monthly performance. Your sheet might look something like this:
| Column A | Column B | Column C | Column D | Column E | Column F | Column G | Column H | Column I | Column J | Column K | Column L | Column M | | :------------------- | :------------ | :------------ | :------------ | :------------ | :------------ | :------------ | :------------ | :------------ | :------------ | :------------ | :------------ | :------------ | | Account Name | Jan | Feb | Mar | Apr | May | Jun | Jul | Aug | Sep | Oct | Nov | Dec | | Revenue | | | | | | | | | | | | | | Sales - Product A | =SUM(...) | =SUM(...) | ... | ... | ... | ... | ... | ... | ... | ... | ... | ... | | Sales - Product B | =SUM(...) | =SUM(...) | ... | ... | ... | ... | ... | ... | ... | ... | ... | ... | | Total Revenue | =SUM(...) | =SUM(...) | ... | ... | ... | ... | ... | ... | ... | ... | ... | ... | | COGS | | | | | | | | | | | | | | Direct Material Cost | =SUM(...) | =SUM(...) | ... | ... | ... | ... | ... | ... | ... | ... | ... | ... | | Direct Labor Cost | =SUM(...) | =SUM(...) | ... | ... | ... | ... | ... | ... | ... | ... | ... | ... | | Total COGS | =SUM(...) | =SUM(...) | ... | ... | ... | ... | ... | ... | ... | ... | ... | ... | | Gross Profit | =B4-B10 | =C4-C10 | ... | ... | ... | ... | ... | ... | ... | ... | ... | ... | | Operating Expenses| | | | | | | | | | | | | | Rent | =SUM(...) | =SUM(...) | ... | ... | ... | ... | ... | ... | ... | ... | ... | ... | | Salaries & Wages | =SUM(...) | =SUM(...) | ... | ... | ... | ... | ... | ... | ... | ... | ... | ... | | Marketing & Ads | =SUM(...) | =SUM(...) | ... | ... | ... | ... | ... | ... | ... | ... | ... | ... | | Utilities | =SUM(...) | =SUM(...) | ... | ... | ... | ... | ... | ... | ... | ... | ... | ... | | Total OpEx | =SUM(...) | =SUM(...) | ... | ... | ... | ... | ... | ... | ... | ... | ... | ... | | Operating Income | =B12-B20 | =C12-C20 | ... | ... | ... | ... | ... | ... | ... | ... | ... | ... | | Other Income/Exp.| | | | | | | | | | | | | | Interest Income | =SUM(...) | =SUM(...) | ... | ... | ... | ... | ... | ... | ... | ... | ... | ... | | Interest Expense | =SUM(...) | =SUM(...) | ... | ... | ... | ... | ... | ... | ... | ... | ... | ... | | Net Income | =B22+B28-B29| =C22+C28-C29| ... | ... | ... | ... | ... | ... | ... | ... | ... | ... |
Note: The `=SUM(...)` placeholders above represent formulas that would pull data from a separate transaction log or summary sheet. For a simpler template, you might manually enter figures or use separate cells for each account's monthly total.
The rows with "Account Name" are your categories. The monthly columns (B through M) are where the figures will appear. You can expand this to include year-to-date totals or quarterly summaries by adding more columns.
Populating Your P&L with Data
The real power of a profit and loss statement template Excel comes from how you populate it. There are two primary methods:
- 01Manual Entry: You manually input the totals for each revenue and expense category for each month. This is straightforward but prone to errors and time-consuming if you have many transactions.
- 02Formula-Based (Recommended): You maintain a separate sheet (often called "Transactions" or "Journal") where you log every income and expense item with its date and category. Then, you use Excel formulas like
SUMIFSorPivot Tablesto aggregate this data into your P&L.
Using SUMIFS for Data Aggregation
If you opt for the formula-based approach, SUMIFS is your best friend. Let's say your transaction log is on a sheet named "Transactions", with columns: Date (Column A), Category (Column B), and Amount (Column C).
To calculate "Sales - Product A" for January in cell B4 of your P&L, you would use a formula like this:
=SUMIFS(Transactions!$C:$C, Transactions!$B:$B, "Sales - Product A", Transactions!$A:$A, ">="&DATE(YEAR(TODAY()),1,1), Transactions!$A:$A, "<="&DATE(YEAR(TODAY()),1,31))
This formula sums amounts in Transactions!$C:$C where the category in Transactions!$B:$B is "Sales - Product A", and the date in Transactions!$A:$A falls within January of the current year. You would then adapt this formula for each account and each month.
For a more dynamic template, you can create a dropdown list for the year and have the formulas adjust automatically. This makes your profit and loss statement template Excel a reusable tool.
Tips for Accurate Expense Tracking
Misclassifying expenses is a common pitfall. Here are some tips to ensure accuracy:
- Define Your Categories Clearly: Before you start logging, decide precisely what goes into each expense category. For example, distinguish between "Marketing" (ads, campaigns) and "Office Supplies" (pens, paper).
- Be Consistent: Use the same category for the same type of expense every time. If a particular expense seems to fit two categories, choose the one that best represents its primary purpose.
- Distinguish COGS from OpEx: This is critical. COGS are directly tied to the sale of a product or service. If you didn't sell anything, you wouldn't incur that cost. OpEx are the costs of keeping the business running, regardless of sales volume.
- Consider a "Miscellaneous" Category Sparingly: While it's tempting to lump unusual expenses here, too much in "Miscellaneous" hides important details. Aim to break down these costs into specific categories if they occur more than once or twice.
- Review Regularly: Set aside time each month to review your logged transactions and ensure they are categorized correctly.
Common Mistakes to Avoid
Beyond miscategorization, other errors can undermine your P&L's usefulness:
- Ignoring Non-Cash Expenses: Depreciation and amortization are non-cash expenses that reduce taxable income and should be included for a complete picture, especially if you're looking at a template for business planning like the Business Plan Profit and Loss Statement Template.
- Mixing Up P&L with Cash Flow: A P&L shows profitability, not liquidity. You can be profitable on paper but still have cash flow problems if customers pay late. A separate cash flow statement is necessary for that.
- Outdated Templates: Using a template that doesn't fit your business model or industry will lead to awkward entries and incomplete data. A Profit and Loss Account Format Template should be adaptable.
- Not Reconciling: Failing to reconcile your P&L totals with actual bank statements or accounting software reports means you can't trust the numbers.
- Overly Complex Formulas: While
SUMIFSis powerful, overly nested or convoluted formulas can become impossible to debug. Keep them as straightforward as possible.
Advanced Features and Considerations
Once you have your basic profit and loss statement template Excel set up, you can add features to enhance its utility.
Variance Analysis
A key aspect of financial analysis is understanding variances, the difference between budgeted amounts and actual results. You can add columns for your budget figures and then a "Variance" column that calculates the difference (Actual - Budget). This helps identify areas where you are over or under budget.
Conditional Formatting
Use conditional formatting to highlight key metrics. For example, you can set a rule to turn Net Income cells red if they are negative, or green if they are positive. You could also highlight variances that exceed a certain percentage threshold (e.g., +/- 10%).
Charts and Graphs
Visualizing your data makes trends easier to spot. You can create charts from your P&L data, such as:
- A line chart showing Total Revenue, Gross Profit, and Net Income over time.
- A bar chart comparing monthly operating expenses.
- A pie chart showing the breakdown of revenue sources or expense categories.
These visualizations can be particularly helpful when presenting financial information to stakeholders or when using a template like the Financial Profit and Loss Template for quarterly reviews.
Year-Over-Year Comparisons
To track long-term performance, you'll want to compare the current year's P&L against previous years. You can achieve this by adding more monthly columns for past years or by creating a separate summary sheet that pulls annual totals from your monthly P&L. The Quarterly Profit And Loss Template could be expanded to annual.
Frequently Asked Questions
How do I make sure my P&L is accurate?
Accuracy comes from meticulous data entry and consistent categorization. Ensure every transaction is logged with the correct date, amount, and category. Reconcile your P&L figures against your bank statements and any accounting software you use regularly. A well-defined chart of accounts is foundational.
Can I use a P&L template for a service-based business?
Absolutely. For service businesses, the "Cost of Goods Sold" section is usually replaced by "Cost of Services" or is minimal. You'll focus more on direct labor costs and other expenses directly tied to delivering the service, alongside your operating expenses like marketing, rent, and administrative salaries.
How often should I update my profit and loss statement?
For most small businesses, updating monthly is ideal. This allows for timely identification of trends, potential issues, and opportunities. Larger or more active businesses might need weekly updates, while very small businesses might get away with quarterly updates, though this is less common for active operations.
What's the difference between a profit and loss statement and a balance sheet?
A profit and loss statement (or income statement) shows a company's financial performance over a specific period (e.g., a month, quarter, or year). It details revenues and expenses to arrive at net income or loss. A balance sheet, on the other hand, is a snapshot of a company's financial position at a single point in time, showing its assets, liabilities, and equity. They are complementary financial statements.