How to analyze a rental property deal in Excel: NOI, cap rate, cash-on-cash and DSCR

A listing says the property "cash flows" and shows a cap rate that looks great. Then you add a realistic vacancy allowance, real insurance, a repair reserve and today's mortgage payment, and the monthly profit disappears.
A listing says the property "cash flows" and shows a cap rate that looks great. Then you add a realistic vacancy allowance, real insurance, a repair reserve and today's mortgage payment, and the monthly profit disappears. Most bad rental purchases are not bad luck. They are deals where the numbers were never run honestly before the offer went in.
To analyze a rental property, you estimate what it will really collect, subtract every operating cost to get net operating income (NOI), then test that income against the price (cap rate), against your cash (cash-on-cash return) and against the loan (debt service coverage ratio, or DSCR). Finally you project it forward to see what the whole hold is worth, including the sale. This guide walks through each step with a worked example you can follow in a spreadsheet.
The five numbers that decide a rental deal
Every metric below answers a different question. Read them together, never one alone.
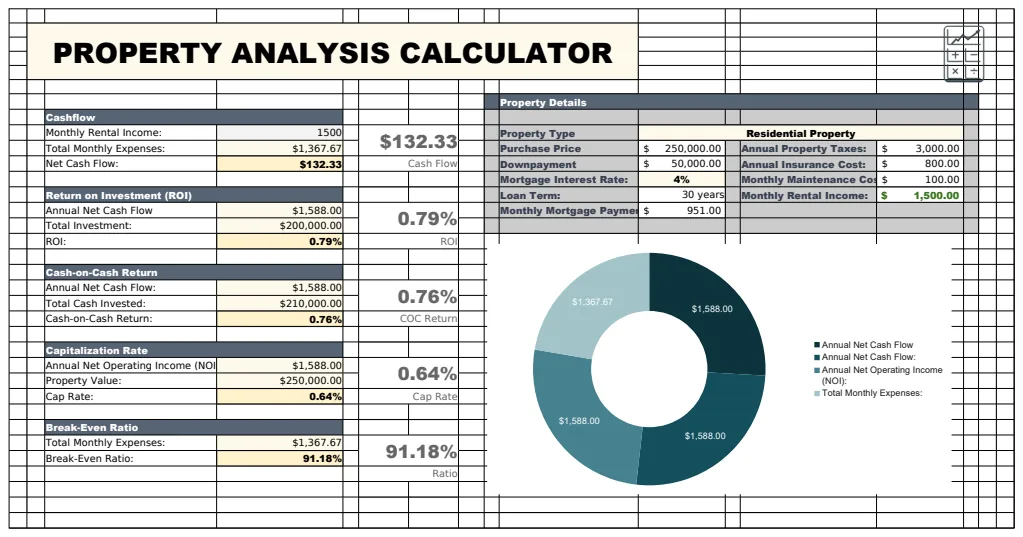
- Net operating income (NOI): what the property earns per year after vacancy and operating costs, before the mortgage. It is the base for almost everything else.
- Cap rate: NOI divided by the purchase price. It tells you the return the property produces on its own, as if you paid cash.
- Cash-on-cash return: annual cash flow after the mortgage, divided by the cash you put in. It tells you what your own money earns each year.
- DSCR: NOI divided by annual debt service. Lenders use it to judge whether the property can carry its loan. Below 1.0 means the rent does not cover the mortgage.
- IRR: the annual return over the whole holding period, counting yearly cash flow plus the profit when you sell. It is the best single number for comparing long holds.
Step 1: estimate income honestly
Start with gross potential rent: every unit rented for a full year at its rent. Then add other income the property actually earns, such as laundry, parking or storage fees. Do not count income you hope to add later as if it already exists.
Next, subtract a vacancy and credit loss allowance. Units sit empty between tenants and some tenants pay late or not at all. Use a rate that matches the local market and the property type, and be more conservative on older buildings or areas with high turnover. What remains is effective gross income, the money you can reasonably expect to collect.
If the current rents are below market, model two cases: current rents and market rents. The gap is your value-add opportunity, but you should only pay for the rents that exist today.
Step 2: list every operating expense
Operating expenses are the costs of running the property, not the mortgage. The usual list:
- Property tax. Use the tax the property will carry after you buy it, not what the seller pays today. In many places a sale triggers a reassessment.
- Insurance. Get a real quote. Insurance costs have risen sharply in some regions, and a listing's figure can be years old.
- Repairs and maintenance. The day-to-day fixes: plumbing calls, appliance repairs, paint.
- Capital expenditure reserve. Money set aside for big replacements such as the roof, HVAC and water heaters. Skipping this line is the most common way a deal looks better on paper than in real life.
- Property management. Even if you plan to self-manage, include it. Your time has a cost, and you may hire a manager later.
- Utilities, landscaping, snow removal, HOA dues and turnover costs where they apply.
Subtract total operating expenses from effective gross income and you have NOI.
Step 3: test the price with cap rate
Cap rate = NOI / purchase price.
A higher cap rate means more income per dollar of price, usually with more risk or more work attached. A lower cap rate is common in expensive, stable markets. There is no universal "good" cap rate, but there is one comparison that matters a lot: your cap rate against your mortgage interest rate. When the cap rate is below the loan rate, borrowing makes the return worse, not better: every borrowed dollar costs more than it earns.
It is also worth calculating cap rate on your all-in cost (price plus closing costs plus rehab), because that is what you really paid.
Step 4: test your cash with cash-on-cash return
First work out annual debt service: twelve months of mortgage principal and interest. Then:
- Annual cash flow = NOI minus annual debt service.
- Cash invested = down payment plus closing costs plus rehab and any reserves you fund up front.
- Cash-on-cash return = annual cash flow / cash invested.
This is the number that tells you whether the property pays you each year, and how that compares with simply leaving the money in a savings account or an index fund.
Step 5: test the loan with DSCR
DSCR = NOI / annual debt service.
A DSCR of 1.0 means the property earns exactly enough to pay the mortgage, with nothing left for surprises. Lenders on investment property loans generally want comfortably more than that, and many investors set their own minimum higher still so a vacancy or a big repair does not force them to pay the mortgage from their salary.
A worked example
Here is a simple single-family rental, with round example numbers.
- Purchase price: $250,000. Closing costs: $6,000. Light rehab: $5,000.
- Rent: $2,100 a month, so gross potential rent is $25,200 a year.
- Vacancy allowance of 5% leaves effective gross income of $23,940.
- Operating expenses: property tax $3,000, insurance $1,500, repairs $1,800, capital reserve $1,200, management at 8 percent of collected rent about $1,915. Total: about $9,415.
- NOI: $23,940 minus $9,415 = $14,525.
- Cap rate: $14,525 / $250,000 = 5.8%.
Now the financing. With 25% down ($62,500), the loan is $187,500. At an example rate of 7% over 30 years, the payment is about $1,247 a month, or $14,969 a year.
- Annual cash flow: $14,525 minus $14,969 = about minus $444.
- Cash invested: $62,500 + $6,000 + $5,000 = $73,500.
- Cash-on-cash return: about minus 0.6%.
- DSCR: $14,525 / $14,969 = 0.97.
On the listing, a 5.8% cap rate might sound fine. Run the full numbers and the property loses money every month, because the cap rate is below the 7% loan rate. The rent also fails the old "one percent rule" screen: monthly rent would need to be $2,500 to equal one percent of the price.
What would make it work? You can test the levers one at a time: a lower price, higher rent after improvements, a larger down payment or a lower rate. This is exactly where sensitivity tables earn their place, because they show the whole grid of outcomes at once instead of one guess.
Look beyond year one: projection, taxes and the sale
A rental is a multi-year investment, so a one-year snapshot is not the full story. A proper projection runs each year forward with assumptions for rent growth, expense inflation, vacancy and property value. It should also account for:
- Principal paydown. Part of every mortgage payment builds equity, even when cash flow is thin.
- Depreciation. In the US, residential rental buildings (not the land) are depreciated over 27.5 years, which can reduce taxable rental income.
- Property tax growth. Some places cap how fast assessed value can rise each year and others reassess on sale. Model your location's rule.
- Selling costs. Agent commission, transfer taxes and closing costs reduce what you keep.
- Taxes on sale. Depreciation you claimed is generally recaptured when you sell, and the remaining gain may be taxed as a capital gain.
Put all of that together and you can calculate the after-tax IRR and equity multiple for any holding period. Tax rules vary by country and state, so treat a spreadsheet projection as an estimate and confirm the details with a tax professional.
Mistakes that make a bad deal look good
- Using the seller's rent roll without checking it. Ask for leases and bank deposits, and compare rents with real listings nearby.
- Leaving out vacancy, capital reserves or management. Each one alone can turn positive cash flow negative.
- Using today's property tax. Your tax bill after purchase may be very different.
- Judging only by cap rate. Cap rate ignores your financing. Always check cash-on-cash and DSCR too.
- Testing one scenario. Run a base case, an optimistic case and a pessimistic case. If the deal only works in the optimistic one, it does not work.
- Forgetting the exit. The sale often makes up a large part of total return, and its costs and taxes are real.
Analyze rental deals with a ready-made workbook
You can build all of this from a blank sheet, but it takes many hours and one broken formula can hide a bad deal. The Rental Property Deal Analyzer puts the full underwriting in one Excel workbook. Enter the price, financing and costs on the master tab and it calculates NOI, cap rate on price and on all-in cost, cash-on-cash return, DSCR, break-even occupancy, gross rent multiplier, debt yield and after-tax IRR, then scores the deal against targets you set.
It also includes a rent roll for 1 to 12 units with current and market rents, location profiles for property tax rules and insurance, a 2026 to 2036 projection with Base, Bull and Bear scenarios, net sale proceeds after recapture and capital gains for every year, sensitivity tables, a Quick Screener that ranks up to six properties side by side and a monthly amortization schedule. The location profiles and scenarios are editable examples, not official rates or forecasts.
If you only need a quick cash flow check or a simple income and expense tracker for a property you already own, these are lighter options:
Common questions
What is a good cap rate for a rental property?
There is no single answer, because cap rates depend on the market, the property type and the risk. What matters more for a financed purchase is how the cap rate compares with your loan rate. If the cap rate is lower than the interest rate, the loan pulls your return down and cash flow will usually be thin or negative.
What is the difference between cap rate and cash-on-cash return?
Cap rate measures the property's income against its price and ignores financing. Cash-on-cash return measures the cash flow after the mortgage against the cash you actually invested. Two investors can buy the same property at the same cap rate and get very different cash-on-cash returns because they financed it differently.
What DSCR do lenders look for?
It depends on the lender and the loan program, so ask yours. A DSCR below 1.0 means the rent does not cover the mortgage, and most investment property lenders want a cushion above that. Setting your own minimum helps you avoid deals where one vacancy puts you underwater.
Should I include property management if I manage it myself?
Yes. Including it keeps the analysis honest about the value of your time, and it shows whether the deal still works if you hire a manager later or sell to an investor who will.
Can I use this in Google Sheets?
The workbook is built for Microsoft Excel (desktop or Excel for the web). You can import it into Google Sheets, but sheet protection does not carry over, so the locked formulas are easier to overwrite there by accident.
Running the numbers before you make an offer is the cheapest protection a rental investor has. You can preview the Rental Property Deal Analyzer free; downloading it is included in the OpenWorksheet monthly plan, along with the rest of the library. Results are estimates, not investment or tax advice.