How to build a project tracker that actually works
Discover how to create a functional project milestone tracker Excel template that goes beyond simple task lists and improves project oversight.
A generic spreadsheet with a few columns for dates and task names rarely captures the full picture when you're trying to manage complex projects. Most people searching for a "project milestone tracker Excel template" need more than just a blank slate; they need structure, clear reporting, and a way to anticipate roadblocks before they derail progress.
You're probably facing a situation where multiple teams, external vendors, or even different phases of a single large project need to be coordinated. Without a system that clearly defines what "done" looks like for each major checkpoint and who is responsible, it's easy to lose sight of the big picture, leading to missed deadlines and budget overruns.
Why a Basic List Falls Short
A simple list of tasks in Excel can quickly become unmanageable. You might have columns for "Task Name," "Start Date," and "End Date," but this doesn't tell you about dependencies, the critical path, or the overall health of the project. Imagine trying to explain to a stakeholder why a project is delayed when all you have is a spreadsheet showing individual task completion dates that don't connect logically. You need to see how each milestone contributes to the overall project timeline and how delays in one area impact others. This is where a well-designed tracker excels.
Key Components of an Effective Milestone Tracker
A robust project milestone tracker should go beyond basic data entry. Consider these essential elements:
- Milestone Name: A clear, concise description of the significant achievement (e.g., "Phase 1 Design Approved," "User Acceptance Testing Complete," "Product Launch").
- Target Completion Date: The planned date for achieving the milestone.
- Actual Completion Date: The date the milestone was actually achieved. This is crucial for tracking variances.
- Status: A clear indicator of progress. Common statuses include "Not Started," "In Progress," "Completed," "Delayed," and "At Risk."
- Owner/Responsible Party: The individual or team accountable for ensuring the milestone is met.
- Dependencies: A reference to any preceding tasks or milestones that must be completed before this one can begin. This is often overlooked but critical for understanding project flow.
- Notes/Comments: A space for brief updates, explanations for delays, or important context related to the milestone.
- Phase/Category: If your project is broken into distinct phases, categorizing milestones helps with reporting and organization.
Building Your Milestone Tracker: A Step-by-Step Approach
Let's walk through setting up a functional project milestone tracker in Excel. We'll use a hypothetical software development project as an example.
- 01Set Up Your Columns: Open a new Excel workbook and create the following column headers in the first row:
Milestone ID(Optional, but good for referencing)Milestone NamePhaseOwnerTarget Start DateTarget Completion DateActual Start DateActual Completion DateStatusDays Variance(Calculated)Notes
- 02Populate Initial Data: Enter your project's key milestones. For our software project, this might include:
- Milestone Name: "Project Kick-off," Phase: "Initiation," Owner: "Project Manager," Target Completion Date: "2024-07-15"
- Milestone Name: "Requirements Gathering Complete," Phase: "Planning," Owner: "Business Analyst," Target Completion Date: "2024-08-01"
- Milestone Name: "UI/UX Design Approved," Phase: "Design," Owner: "Design Lead," Target Completion Date: "2024-08-20"
- Milestone Name: "Development Phase 1 Complete," Phase: "Development," Owner: "Development Lead," Target Completion Date: "2024-10-15"
- Milestone Name: "User Acceptance Testing (UAT) Start," Phase: "Testing," Owner: "QA Lead," Target Completion Date: "2024-11-01"
- Milestone Name: "Product Launch," Phase: "Deployment," Owner: "Product Manager," Target Completion Date: "2024-12-01"
- 03Implement Status Dropdowns: In the
Statuscolumn, use Data Validation to create a dropdown list. Select the range of cells in theStatuscolumn, go toData>Data Validation, chooseListfor "Allow," and enter your statuses in the "Source" box, separated by commas:Not Started,In Progress,Completed,Delayed,At Risk.
- 04Calculate Variance: In the
Days Variancecolumn, enter a formula to calculate the difference between the target and actual completion dates. For cellK2(assuming your data starts in row 2 andG2isActual Completion Date,F2isTarget Completion Date), you can use:
=IF(G2="","",G2-F2) This formula checks if an actual completion date exists. If it does, it subtracts the target date from the actual date. If not, it leaves the cell blank. Drag this formula down for all your milestones. A positive number means it was completed late; a negative number means it was completed early.
- 05Conditional Formatting for Visual Cues: This is where your tracker really comes alive.
- Status Highlighting: Select the
Statuscolumn (e.g.,I2:I100). Go toHome>Conditional Formatting>New Rule. Choose "Format only cells that contain." Set "Cell Value" to "is equal to" and enter "Completed." Click "Format" and choose a green fill. Repeat this process for "Delayed" (red fill), "At Risk" (yellow fill), and "In Progress" (blue fill). - Variance Highlighting: Select the
Days Variancecolumn (e.g.,K2:K100). Use conditional formatting again. Set up rules for: - "Greater than 0" (red fill) to highlight late milestones.
- "Less than -7" (green fill) to highlight significantly early milestones (you can adjust this threshold).
- "Between 0 and 7" (yellow fill) to highlight milestones that are close to their target date but not yet completed, or slightly late.
- 06Add a Summary Dashboard (Optional but Recommended): On a separate sheet, you can create a summary using formulas like
=COUNTIF(Sheet1!I:I, "Completed")to show the total number of completed milestones, or=SUM(Sheet1!K:K)/COUNTIF(Sheet1!I:I, "<>Completed")to calculate the average variance for completed milestones. This provides a quick, high-level overview.
Common Pitfalls to Avoid
Many users stumble when implementing their project milestone tracker. Be mindful of these common mistakes:
- Not Defining Milestones Clearly: If a milestone is ambiguous, it's hard to know when it's truly achieved. "Start development" is less effective than "Development environment set up and initial code commits made."
- Forgetting Dependencies: Failing to map out which milestones must be completed before others can start is a recipe for delays. A Gantt chart view, often available in more advanced project management tools or certain Excel templates, can visualize these relationships.
- Infrequent Updates: A milestone tracker is only useful if it's kept current. Schedule regular check-ins with your team to update statuses and actual dates.
- Overly Complex Templates: Trying to cram too much into a single Excel sheet can make it unwieldy. Sometimes, a dedicated project management tool is a better fit, but for many projects, a well-structured Excel template will suffice.
- Not Using Visual Cues: Relying solely on raw data without conditional formatting or charts makes it harder to quickly spot problems.
Advanced Tracking and Reporting
Once your basic tracker is in place, you can enhance it. Consider adding:
- Progress Percentage: A column where you can manually input the estimated percentage completion for "In Progress" milestones.
- Risk Assessment: A column for "Risk Level" (e.g., Low, Medium, High) that can be visually highlighted.
- Visualizations: Create charts, such as a bar chart showing the number of milestones per phase or a timeline view if you're comfortable with more advanced Excel features or use a template designed for it.
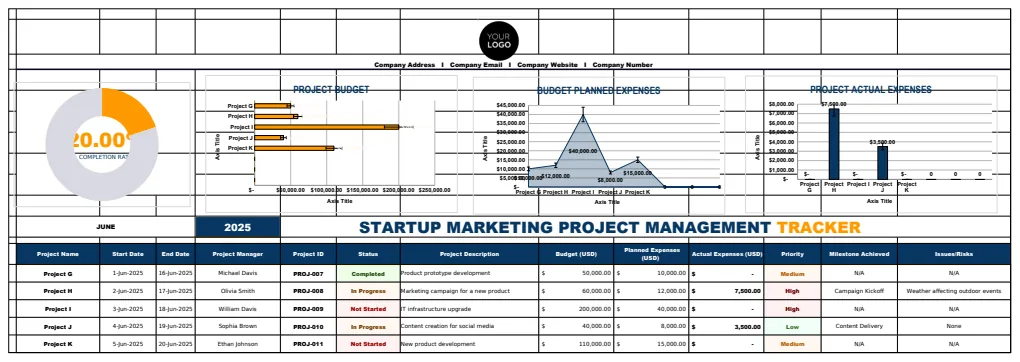
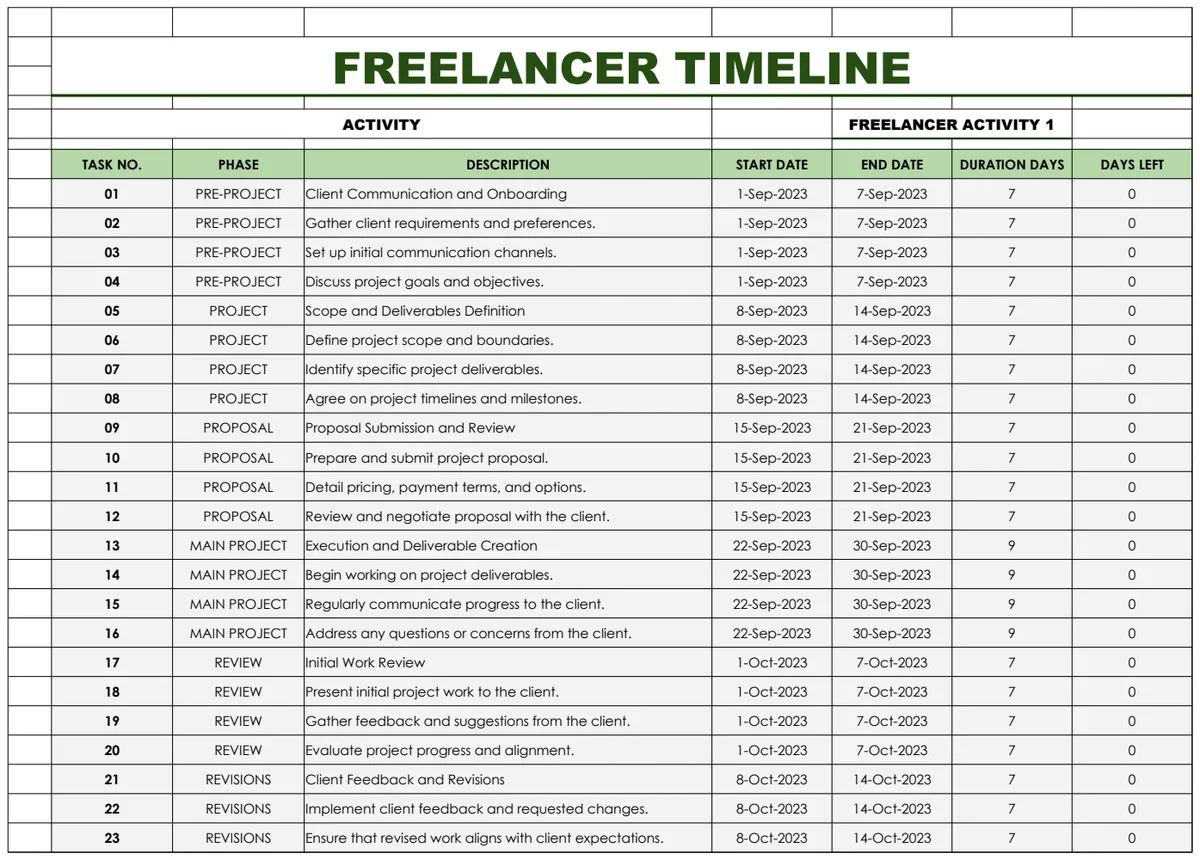
For businesses managing multiple client projects or complex internal initiatives, a more specialized solution might be beneficial. Templates like the Startup Marketing Project Management Tracker Template or the Construction Project Plan Template offer pre-built structures tailored for specific industries. Similarly, freelancers often find a Freelancer Timeline Template or a Dissertation Timeline Gantt Chart more aligned with their needs.
Can I track task dependencies in Excel?
Yes, but it requires careful setup. You can add columns for "Predecessor Milestone ID" and then use formulas, or even VBA, to flag potential issues if a predecessor isn't completed. However, visualizing dependencies with lines and critical paths is much easier in dedicated Gantt chart software or specialized Excel templates.
How often should I update my milestone tracker?
For active projects, daily or at least weekly updates are essential. Milestones are significant points, so even if a task is "In Progress," you need to know if it's moving towards completion or facing issues.
What if my project has many phases?
If your project is large and has distinct phases, consider adding a "Phase" column as described earlier. You can then use pivot tables or summary formulas to report on milestones by phase, giving you a clearer overview of progress within each stage of the project lifecycle. This segmentation is key for managing complexity.