How to make your weekly project status report in Excel
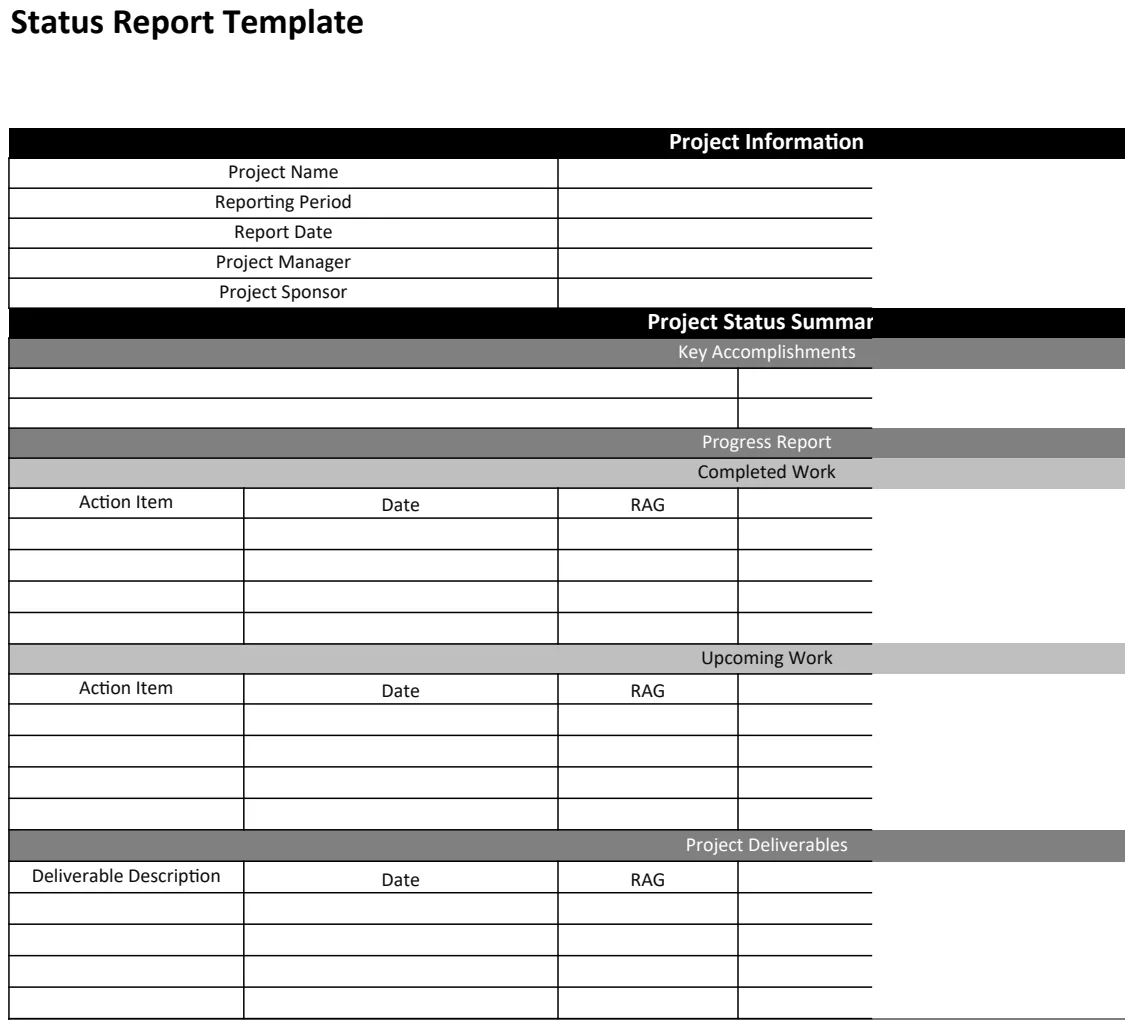
A good weekly project status report template in Excel simplifies data entry and focuses on essential information for timely updates.
The most common reason for a weekly project status report template Excel document to become useless is a lack of consistent data entry, often stemming from the report being too complex or time-consuming to fill out. This leads to outdated information, missed risks, and stakeholders making decisions based on bad data. A good template simplifies the process, focusing on essential information needed for timely updates.
You need a system that captures progress, highlights roadblocks, and communicates status clearly to everyone involved. A well-structured weekly project status report template Excel file can be your central hub for this. It’s not just about tracking tasks; it’s about managing expectations and proactively addressing issues before they derail your project timeline or budget.
Why a Standardized Report Matters
Using a standardized template ensures that key information is always presented in the same format. This consistency is vital for busy stakeholders who need to quickly grasp project health. Without it, you risk ambiguity and misinterpretation. For instance, if one week’s report uses red to mean "at risk" and the next week uses red for "completed," you've created confusion. A well-designed template standardizes these indicators.
This consistency also helps you, the project manager, to track trends over time. By looking back at previous reports, you can spot recurring issues, identify bottlenecks, and assess the effectiveness of mitigation strategies. It’s like having a project diary that highlights patterns you might otherwise miss.
Essential Components of Your Weekly Report
A robust weekly project status report template Excel should cover several critical areas. Think about what information your stakeholders absolutely need to know to make informed decisions and what you need to track to keep the project on course.
- Project Identification: Clearly state the project name, report date, and the reporting period (e.g., "Week of October 23rd"). This avoids any confusion about which project and what timeframe is being discussed.
- Overall Status: A high-level summary. This is often a traffic light system (Red, Amber, Green) for key areas like Schedule, Budget, Scope, and Resources. Brief narrative explanations for any Amber or Red statuses are crucial here.
- Key Accomplishments This Period: What did the team actually complete? Be specific with quantifiable results where possible. Instead of "Worked on feature X," try "Completed user authentication module for feature X."
- Planned Activities for Next Period: What's on the agenda for the upcoming week? Again, be specific. This sets expectations and allows stakeholders to anticipate upcoming milestones or dependencies.
- Issues and Risks: This is arguably the most critical section. List any current issues (problems already occurring) and risks (potential problems). For each, include a description, impact assessment, and the mitigation/resolution plan. Assign an owner and a target resolution date.
- Decisions Needed: Are there any outstanding decisions required from stakeholders to keep the project moving? Clearly articulate the decision needed and the deadline.
- Key Performance Indicators (KPIs): If your project has specific metrics you're tracking (e.g., budget variance, completion percentage, defect rate), present them here.
This structure provides a comprehensive yet digestible overview. If your project is more complex or requires visual timelines, a template like the Project Status Report Gantt Chart might offer a more detailed view of schedule progress.
Building Your Template in Excel
Let’s walk through setting up a basic but effective weekly project status report template Excel file. We’ll use standard Excel features that are available in most versions.
- 01Set up the Header: On a new sheet, create a section for project identification.
- In cell A1, type "Project Name:". In B1, enter your project’s name (e.g., "Website Redesign").
- In cell A2, type "Report Date:". In B2, enter today’s date. You can use the formula
=TODAY()to have it update automatically. - In cell A3, type "Reporting Period:". In B3, enter a formula like
=B2-7&" - "&B2to show the past week’s date range. - In cell A5, type "Overall Status:". You can then use cells B5, C5, D5, and E5 for your traffic light indicators (e.g., "Schedule," "Budget," "Scope," "Resources").
- 02Implement Traffic Lights: For the "Overall Status" section, you can use conditional formatting.
- Select cells B5:E5.
- Go to the "Home" tab, then "Conditional Formatting," then "New Rule."
- Choose "Format only cells that contain."
- Set the rule for "Cell Value" "equal to" "Green." Click "Format" and choose a green fill color. Click "OK."
- Repeat this process for "Amber" (yellow fill) and "Red" (red fill). Ensure you have distinct text labels in cells B5:E5 to trigger these rules.
- 03Create Sections for Details: Below the header, create distinct areas for the other components.
- In cell A7, type "Key Accomplishments This Period". Make this cell bold and perhaps add a bottom border.
- In cell A8, start a bulleted list. You can manually type bullet points or use the bulleting tool on the "Home" tab. Add a few rows for entries.
- In cell A15, type "Planned Activities for Next Period". Repeat the formatting.
- In cell A16, start another bulleted list.
- 04Set up Issues and Risks: This section needs more structure for clarity.
- In cell A25, type "Issues & Risks". Format as before.
- In row 26, create column headers: "ID", "Type (Issue/Risk)", "Description", "Impact", "Mitigation/Resolution Plan", "Owner", "Status", "Due Date".
- Select these headers and make them bold. Apply a fill color to the row for distinction.
- You can now enter data row by row for each issue or risk. For the "Status" column, consider using data validation with a dropdown list (e.g., "Open," "In Progress," "Resolved," "Closed").
- 05Add Decisions Needed and KPIs:
- In cell A40, type "Decisions Needed". Follow the bulleted list format.
- In cell A45, type "Key Performance Indicators (KPIs)". You can then list your KPIs in the column next to it, with their current values.
This basic layout provides a solid foundation. You can add more columns, rows, or even separate sheets for more detailed information as needed. For a more visually driven approach, consider the Project Status Report Gantt Chart.
Refining Your Template for Efficiency
The goal is to make filling out the report as painless as possible. If it takes an hour to complete, people will find excuses.
- Keep it Concise: Avoid jargon and lengthy prose. Use bullet points and short, direct sentences.
- Pre-populate Recurring Information: For elements like project name, reporter, and reporting period, you can often set these up so they don't need to be re-entered every week.
- Use Data Validation: For fields like "Status" or "Priority," dropdown lists ensure consistency and save typing.
- Automate Where Possible: Use formulas for dates, calculations, or even to pull data from other project sheets if you have them.
- Template Management: Save your filled-out report as a new file each week (e.g., "ProjectX_StatusReport_2023-10-23.xlsx"). This preserves the previous week's report and ensures you're starting fresh.
If your project management style is more agile, an Agile Project Status Report Template might be a better fit, offering features tailored to sprint-based work.
Common Pitfalls to Avoid
Even with a great template, projects can falter if the reporting process is mishandled.
- Inconsistent Updates: Not filling out the report every week. This is the fastest way to make it obsolete.
- Vague Entries: "Progress made" is not helpful. Specify what progress. "Issues resolved" is better than just "Issues."
- Ignoring Risks: Downplaying or omitting potential problems out of fear or optimism. Risks are meant to be identified and managed.
- Lack of Action: Reporting issues or risks but not following up with concrete action plans or owners.
- Overly Detailed Reports: Too much information can obscure the critical updates. Stick to what stakeholders need to know for decision-making.
- Not Tailoring to Your Audience: A report for a technical team might differ from one for executive leadership. Understand who is reading it and what their priorities are.
Frequently Asked Questions
How often should I update my weekly project status report?
You should aim to complete and distribute your report once every week, ideally at the same time each week. Consistency is key for stakeholders to build a reliable reporting rhythm. Ensure the data reflects the project's status as of the end of the reporting period.
What if my project isn't very active this week?
Even during slower weeks, a report is necessary. It should reflect that minimal activity occurred, confirm that no new issues have arisen, and state the planned activities for the upcoming week. A blank report is still a report, indicating that the project is either on track with low activity or that there are no significant changes to report.
Can I use this template for multiple projects?
Yes, absolutely. You can save a copy of your template for each project. The core structure will remain the same, but you'll update the project-specific details like the name, specific accomplishments, and issues. This ensures consistency across your project portfolio.
Where can I find pre-built templates?
Many platforms offer ready-to-use templates. For example, you can find a Status Report Template that covers the essentials or explore other specialized options. Building your own, as outlined here, allows for perfect customization, and if you decide to purchase a set of templates, the library costs $9 once for unlimited downloads.