Track rental income and expenses with this easy spreadsheet
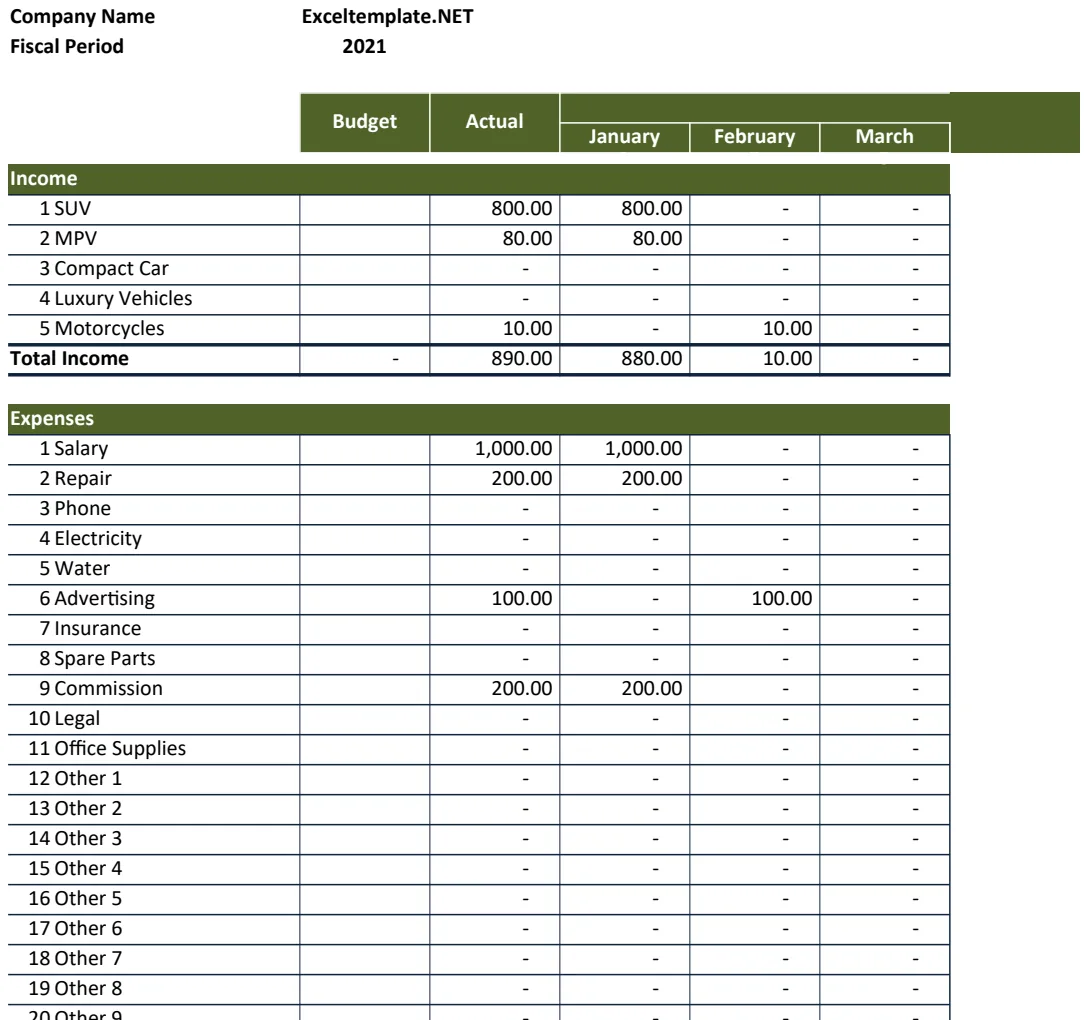
A detailed rental income and expense spreadsheet is crucial for understanding your property's financial performance and making informed decisions.
The most common failure of a rental income and expense spreadsheet isn't a complex formula error, but a simple lack of detail. Without specific line items for income sources and expense categories, it's impossible to see where money is truly going or coming from. This often leads to a spreadsheet that’s technically functional but analytically useless, making informed decisions about property management or investment harder than it needs to be.
A well-structured rental income and expense spreadsheet acts as the backbone of profitable property ownership. It’s not just about recording numbers; it's about understanding trends, identifying cost-saving opportunities, and accurately calculating your net profit. Whether you own a single duplex or a portfolio of apartment buildings, having this system in place is non-negotiable for financial clarity and growth.
Setting Up Your Income Tracking
Start by creating clear columns for all potential income streams. For a typical rental property, this means a column for "Rent Collected." But don't stop there. If you charge for late fees, include a "Late Fee Income" column. Pet fees? Add a "Pet Fee Income" column. Laundry facilities or vending machines? Separate columns for those too.
The key is to break down income so you can see the performance of each revenue source. This helps you understand if, for example, your pet fee policy is actually generating significant additional income or if it’s just a minor add-on. For properties with multiple units, you'll want to add a "Unit Identifier" column so you can track income on a per-unit basis, which can be invaluable for diagnosing issues with specific rentals. A robust system like the Rental Property Income and Expenses Tracker can help organize this from the start.
Detailed Expense Categorization
This is where most spreadsheets fall short. Instead of a single "Maintenance" line item, break it down. You should have separate columns for:
- Repairs: General fixes, like a leaky faucet or a broken window.
- Plumbing: Specific to water and sewer issues.
- Electrical: For any wiring or power problems.
- HVAC: Heating, ventilation, and air conditioning maintenance and repairs.
- Pest Control: Regular treatments or exterminator visits.
- Landscaping/Yard Work: Mowing, gardening, snow removal.
- Cleaning: For move-out cleans or common area upkeep.
- Property Management Fees: If you use a third-party manager.
- Advertising/Marketing: Costs associated with finding new tenants.
- Insurance: Property, landlord, or liability insurance premiums.
- Property Taxes: Annual or semi-annual tax payments.
- Mortgage Interest: The portion of your mortgage payment that is interest.
- Utilities: If you cover water, gas, electric, or trash for tenants.
- HOA Dues: If applicable.
- Capital Expenditures (CapEx): This is crucial. Think major upgrades like a new roof, new appliances, or a complete HVAC system replacement. These are typically much larger expenses and should be tracked separately from routine repairs.
For each expense, also include a column for "Date Paid" and "Vendor/Payee." This information is vital for tax purposes and for negotiating with service providers.
Tracking Vacancy and Unit Status
A critical, often overlooked, part of your rental income and expense spreadsheet is tracking vacancy. You need to know how long a unit sits empty between tenants. This directly impacts your profitability.
Add columns like:
- Unit Identifier: (e.g., Unit 101, Apt A)
- Tenant Name: (If occupied)
- Lease Start Date:
- Lease End Date:
- Days Vacant: This can be a simple formula:
=IF(ISBLANK(C2), TODAY()-B2, "")assuming your "Lease Start Date" is in column B and "Tenant Name" is in C. You’d adjust this logic based on how you track occupancy. - Rent Amount: Per unit.
By tracking vacancy alongside income, you can calculate your actual rent loss due to turnover and identify patterns. A unit that’s consistently vacant for long periods might have issues with rent pricing, condition, or marketing.
Putting It All Together with Formulas
Once your columns are set up, formulas become your best friend for summarizing data.
- Total Monthly Income: Use
=SUM(Income_Column_Range)for each month. - Total Monthly Expenses: Use
=SUM(Expense_Column_Range)for each month. - Net Operating Income (NOI): Calculate this for each month:
=Total_Monthly_Income - Total_Monthly_Expenses_Excluding_Mortgage_Interest_And_CapEx. This is a key metric for assessing property performance before financing and major investments. - Cash Flow: For a clearer picture of what hits your bank account, calculate:
=Total_Monthly_Income - Total_Monthly_Expenses_Including_Mortgage_Interest_And_CapEx.
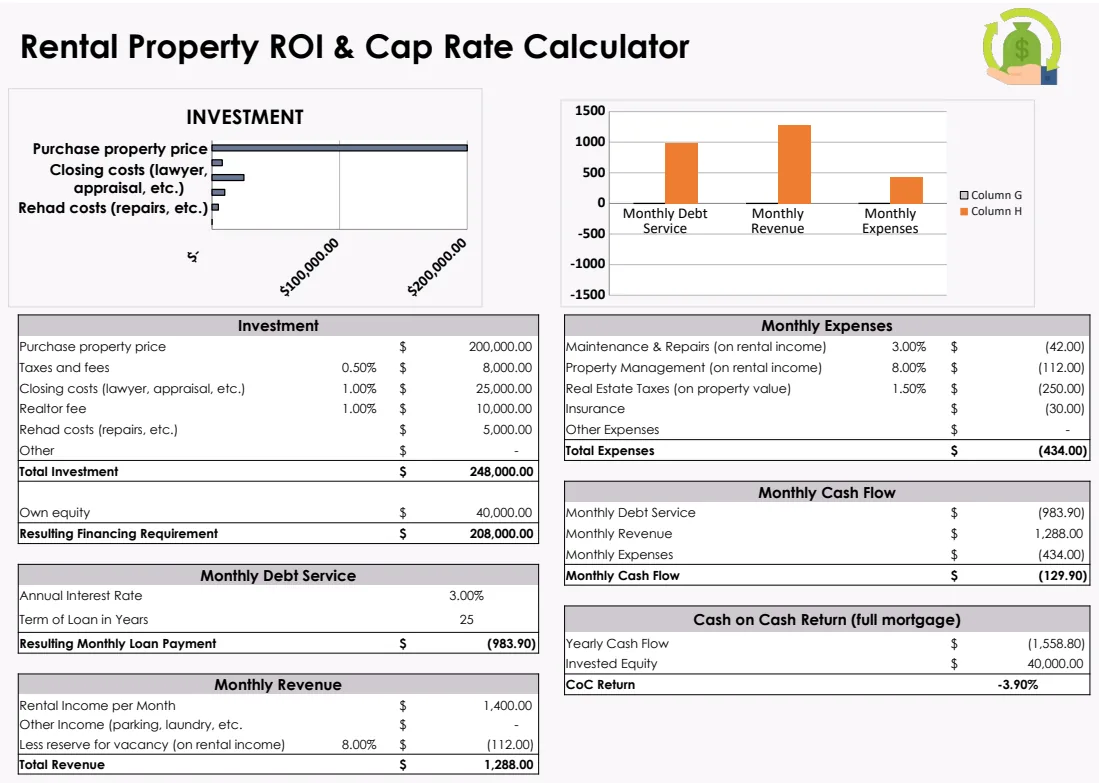
For more advanced analysis, such as comparing budget to actuals or projecting future income, a template like the Rental Property Income and Expenses Model can save you immense setup time.
Using Conditional Formatting
Make your spreadsheet easier to read and identify issues at a glance with conditional formatting.
- Highlight Overdue Rent: If you have a "Rent Due Date" and a "Date Paid" column, you can set a rule to highlight rows where the "Date Paid" is blank and the "Rent Due Date" is in the past.
- Flag High Expenses: Set a rule to highlight any expense category that exceeds a certain threshold you define (e.g., any single repair cost over $500). This draws your attention to potentially problematic costs.
- Indicate Vacancy Periods: Highlight units that have been vacant for more than a predetermined number of days (e.g., 30 days).
Common Mistakes to Avoid
- Overly Broad Categories: As mentioned, lumping all repairs under one heading hides details. This is the most common pitfall.
- Ignoring Capital Expenditures: Treating a new roof like a routine repair distorts your monthly profit. CapEx should be tracked separately, often with a sinking fund in mind.
- Not Tracking Tenant-Specific Income/Expenses: If you charge a tenant for damage, you need to tie that income back to the specific unit and possibly the tenant.
- Forgetting "Soft" Costs: Things like minor administrative tasks, occasional legal advice, or even mileage for property visits might not seem like much, but they add up. Decide if you want to track these granularly.
- Not Reconciling: Periodically, compare your spreadsheet totals to your bank statements and credit card statements. Discrepancies indicate errors that need fixing.
Frequently Asked Questions
How often should I update my rental income and expense spreadsheet?
Ideally, you should update your spreadsheet weekly, or at least bi-weekly. Recording income and expenses as they occur prevents data from being forgotten and ensures accuracy. For larger expenses or income events, log them immediately.
Can I use this for multiple properties?
Absolutely. You can either have separate tabs within a single workbook for each property, or create entirely separate spreadsheets. The latter is often cleaner if you have a significant number of properties, as it prevents one property's data from accidentally affecting another. Most templates can be duplicated for this purpose.
What's the difference between Net Operating Income (NOI) and Cash Flow?
NOI measures the profitability of the property itself, before accounting for financing costs like mortgage interest or principal payments, and before major capital expenditures. Cash flow is the actual money left in your pocket after all expenses, including mortgage payments and CapEx, are accounted for. Both are important, but they tell different stories about your investment’s health.
When should I consider a professional template?
If you're spending more time building and troubleshooting your spreadsheet than analyzing your rental business, it’s time for a professional template. Templates are pre-built with common categories, formulas, and tracking mechanisms, saving you hours of setup. They often include features like depreciation tracking or loan amortization summaries, which can be complex to build from scratch. A well-designed solution, like the Rental Property Cash Flow Analysis, can provide immediate insights. The entire library is available for a one-time fee of $9, granting unlimited downloads.