Category
Sales & CRM
Templates for forecasting sales, tracking leads, and analyzing performance.
186 templates

 Sales & CRM
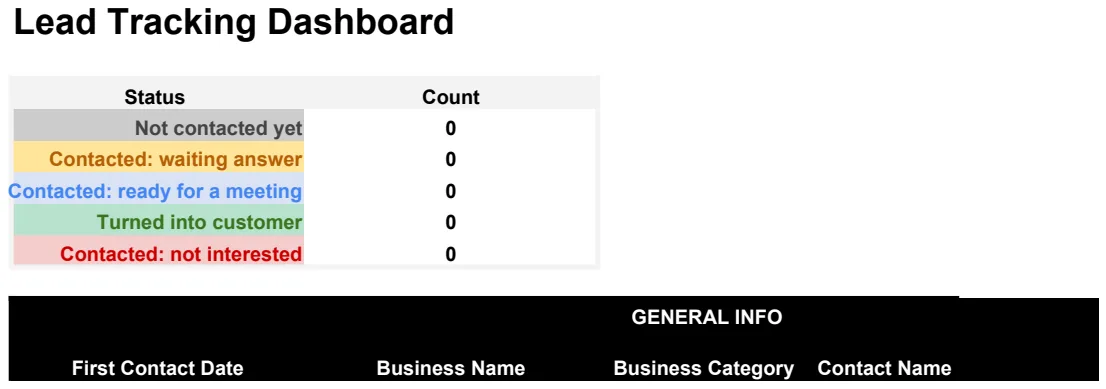
Lead Tracking Dashboard
Track and count leads by status to monitor your sales pipeline and conversion flow.
- Automatic lead counting by status
- Status breakdown dashboard
- Real-time pipeline visibility
 Sales & CRM
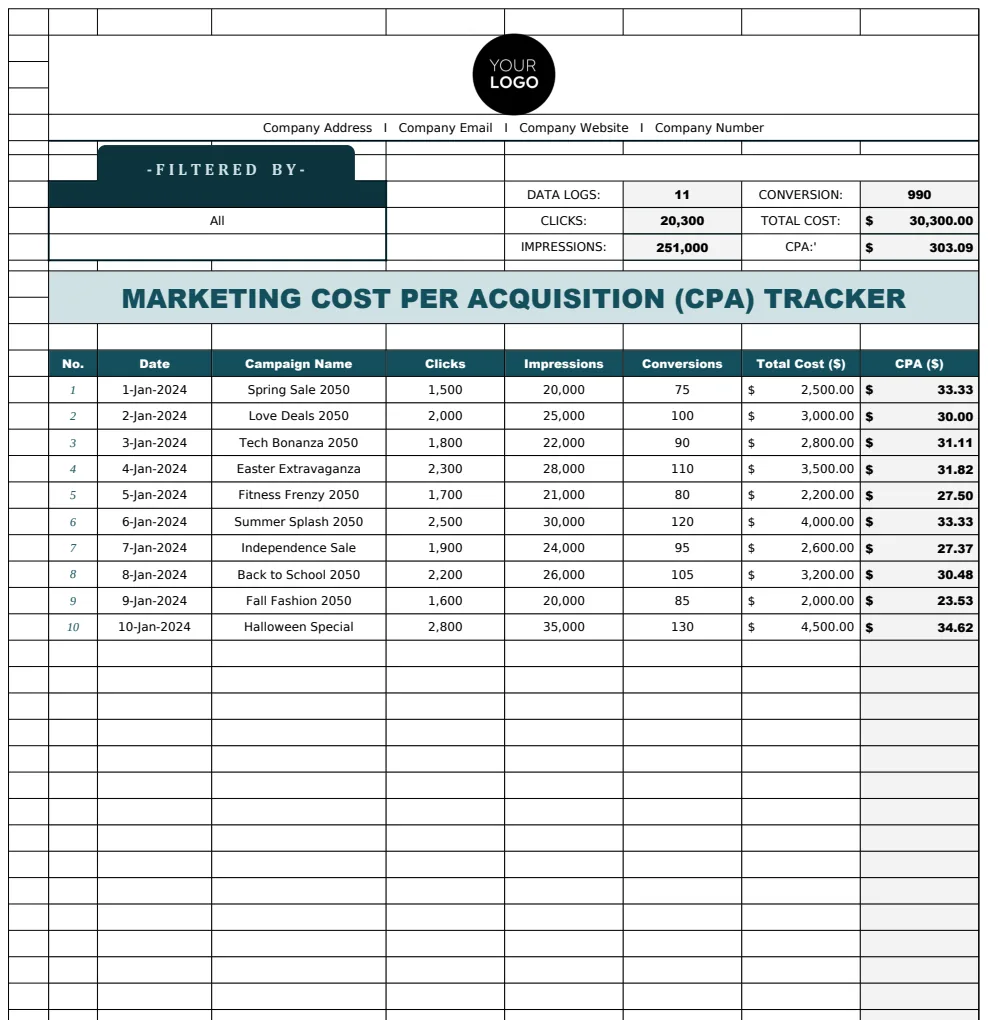
Marketing Cost Per Acquisition (CPA) Tracker Template
Track and analyze marketing campaign performance by monitoring clicks, impressions, and cost per acquisition metrics across multiple campaigns.
- Monthly campaign tracking
- Click and impression logging
- Campaign name validation
 Sales & CRM
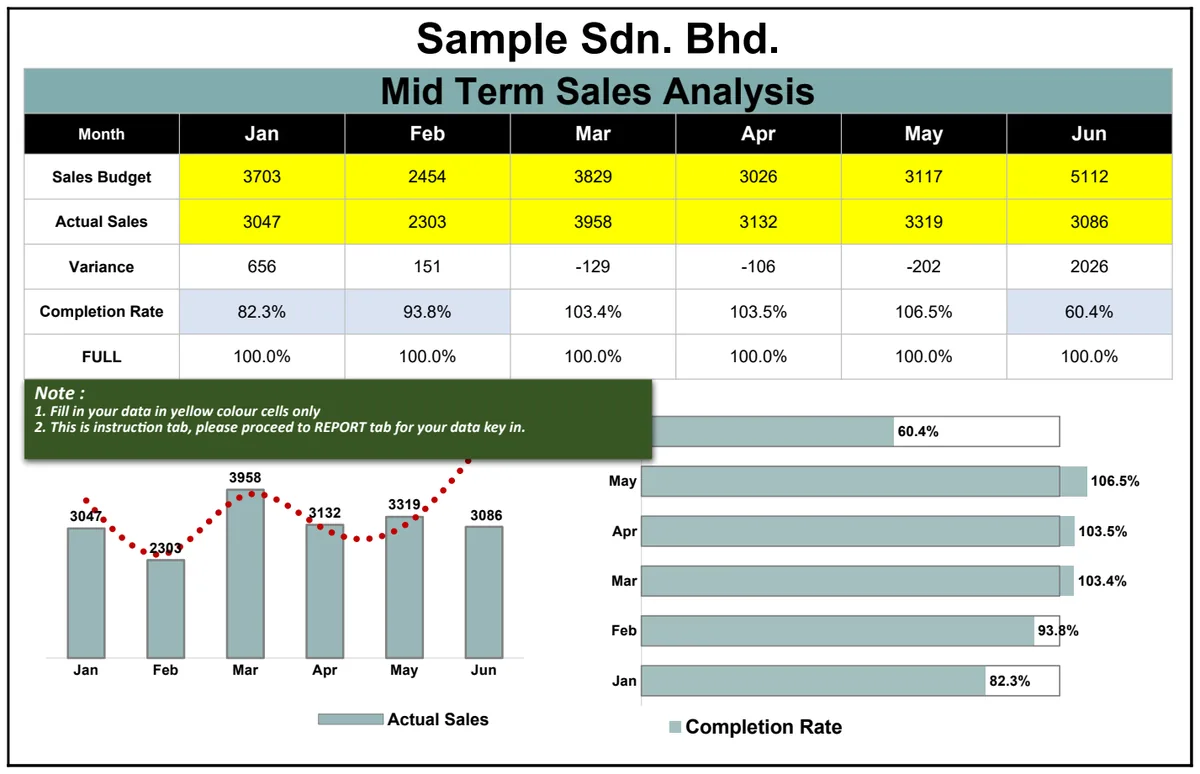
Mid Term Sales Analysis
Track and visualize sales performance across months with built-in charts to identify trends and patterns.
- Monthly sales data entry
- Built-in charts for visual trend analysis
- Pre-formatted reporting structure
 Sales & CRM
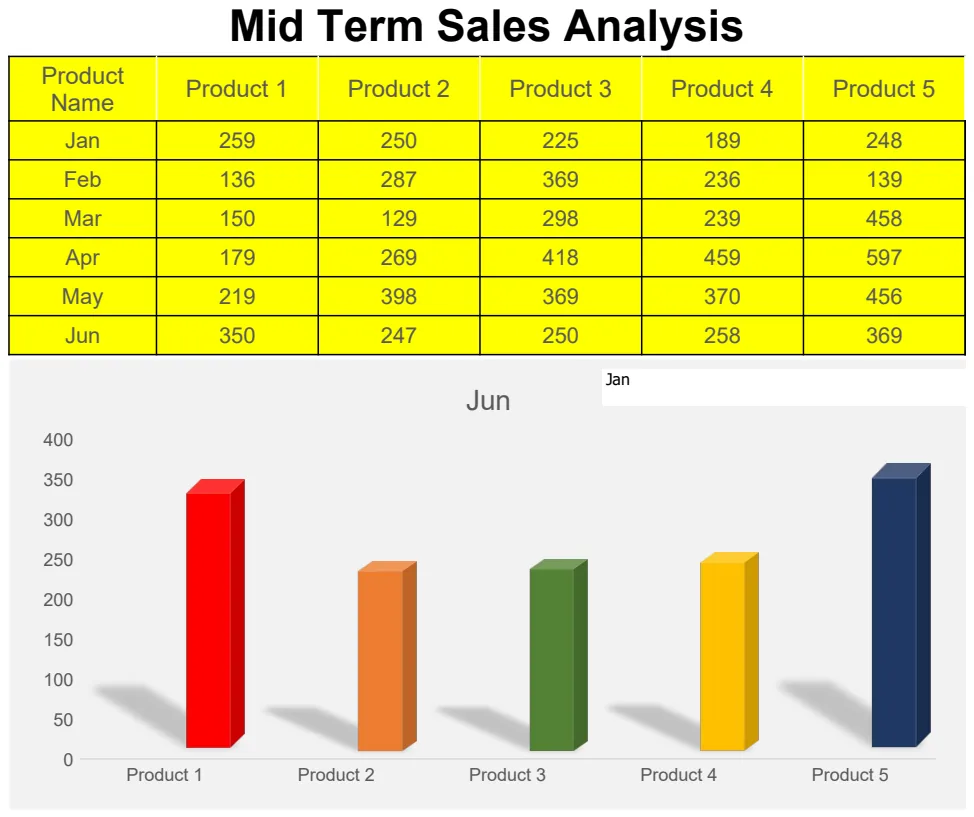
Mid Term Sales Analysis
Track and visualize product sales performance across multiple months to identify trends and top performers.
- Monthly sales data by product
- Comparative product performance table
- Built-in charts for trend visualization
 Sales & CRM
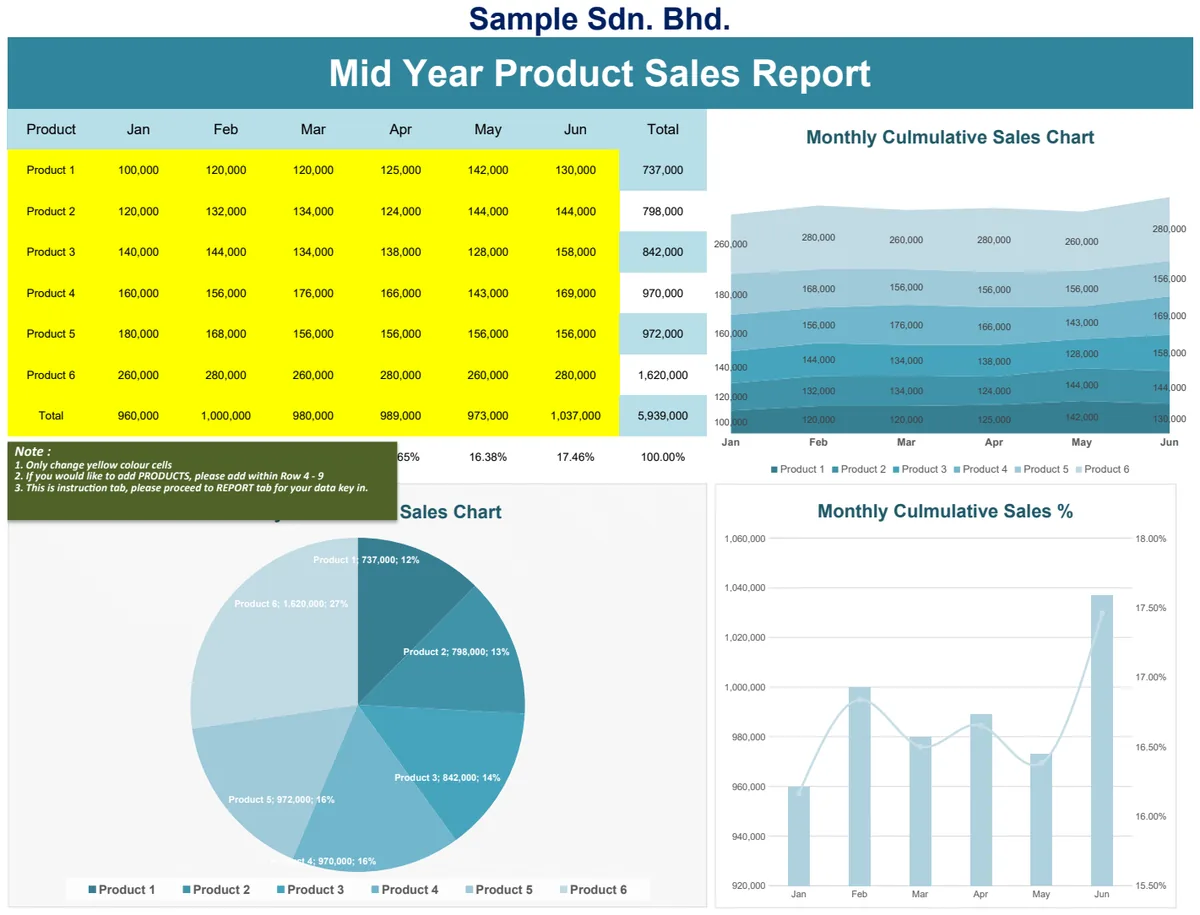
Mid Year Product Sales Report
Track product sales performance across six months with monthly breakdowns and visual charts.
- Monthly sales columns (Jan–May)
- Product-level sales breakdown
- SUM formulas for total calculations
 Sales & CRM
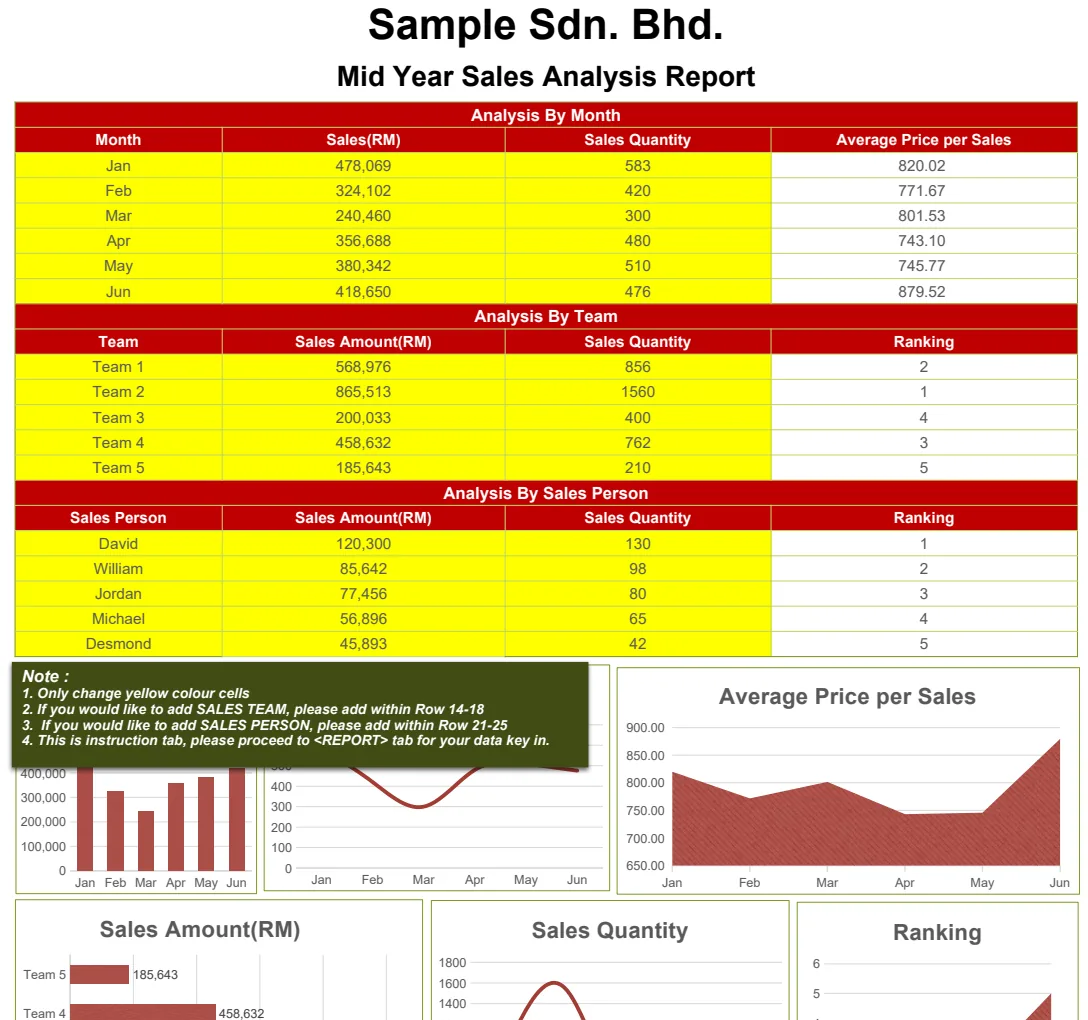
Mid Year Sales Analysis Report
Track and analyze sales performance month-by-month with ranking functions and visual charts.
- Month-by-month sales breakdown
- Automatic ranking of sales metrics
- Visual charts for trend analysis
 Sales & CRM
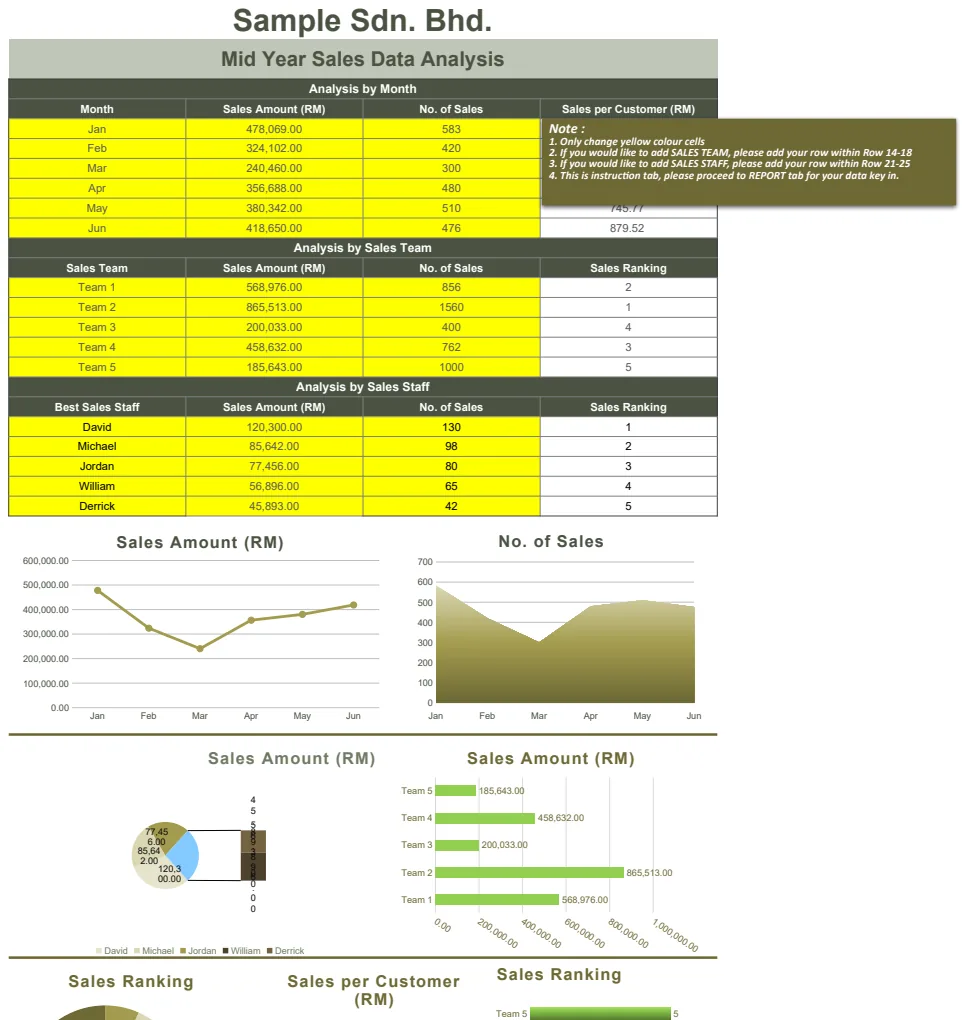
Mid Year Sales Data Analysis
Track and analyze sales performance by month with ranking functions and visual charts.
- Monthly sales data organization
- RANK function for performance ranking
- Pre-built sales charts and graphs
 Sales & CRM
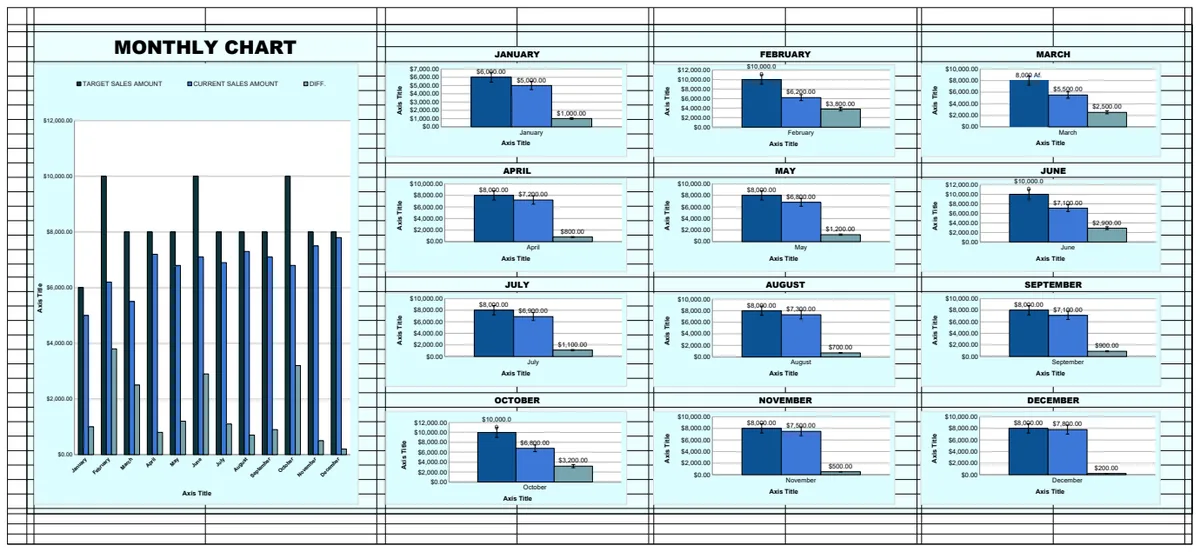
Monthly Chart Template
Track monthly sales performance with target vs. current sales comparison and visual charts
- Monthly data organization
- Target vs current sales comparison
- Automatic difference calculation
 Sales & CRM
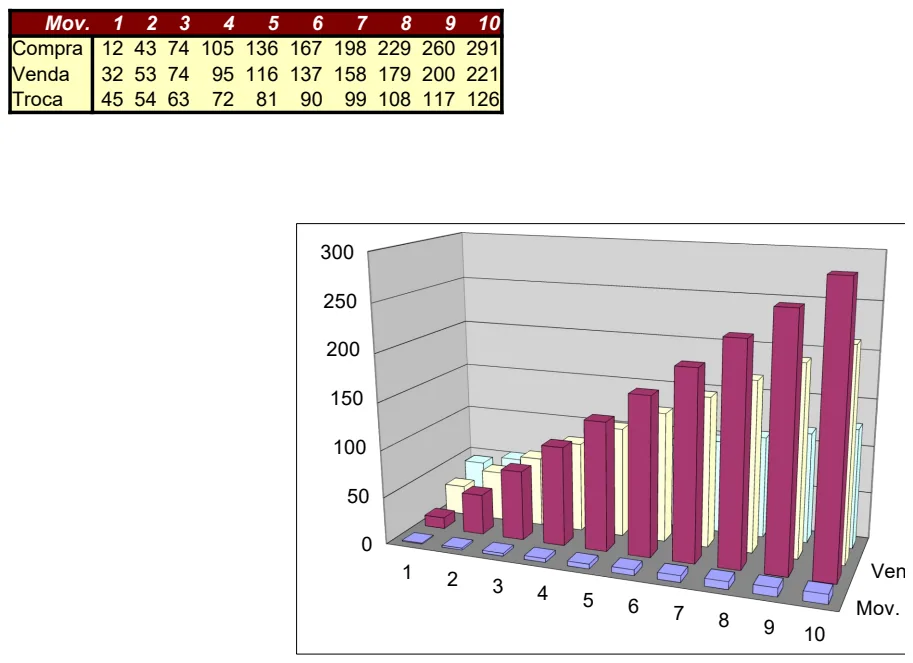
Monthly Sales & Purchase Tracker
Track monthly purchases and sales volumes across 10 periods with visual charts for trend analysis.
- Dual-row transaction tracking (Purchases & Sales)
- 10-period data capture
- Built-in charts for visual comparison
 Sales & CRM
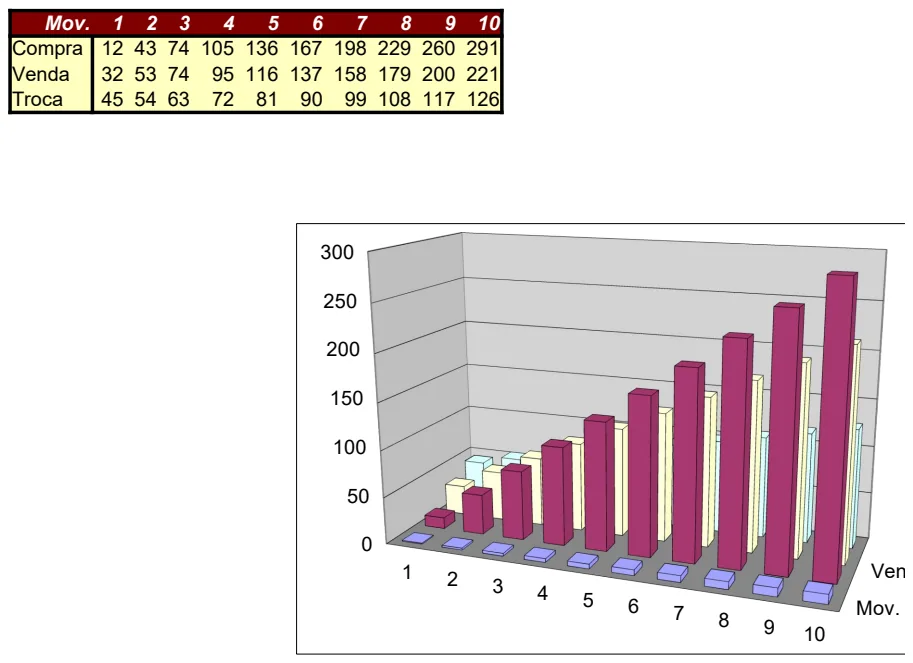
Monthly Sales & Purchase Tracking
Track monthly purchases and sales with movement analysis and visual charts.
- Monthly sales and purchase columns
- Automatic charting of movement data
- Simple row-based transaction summary
 Sales & CRM
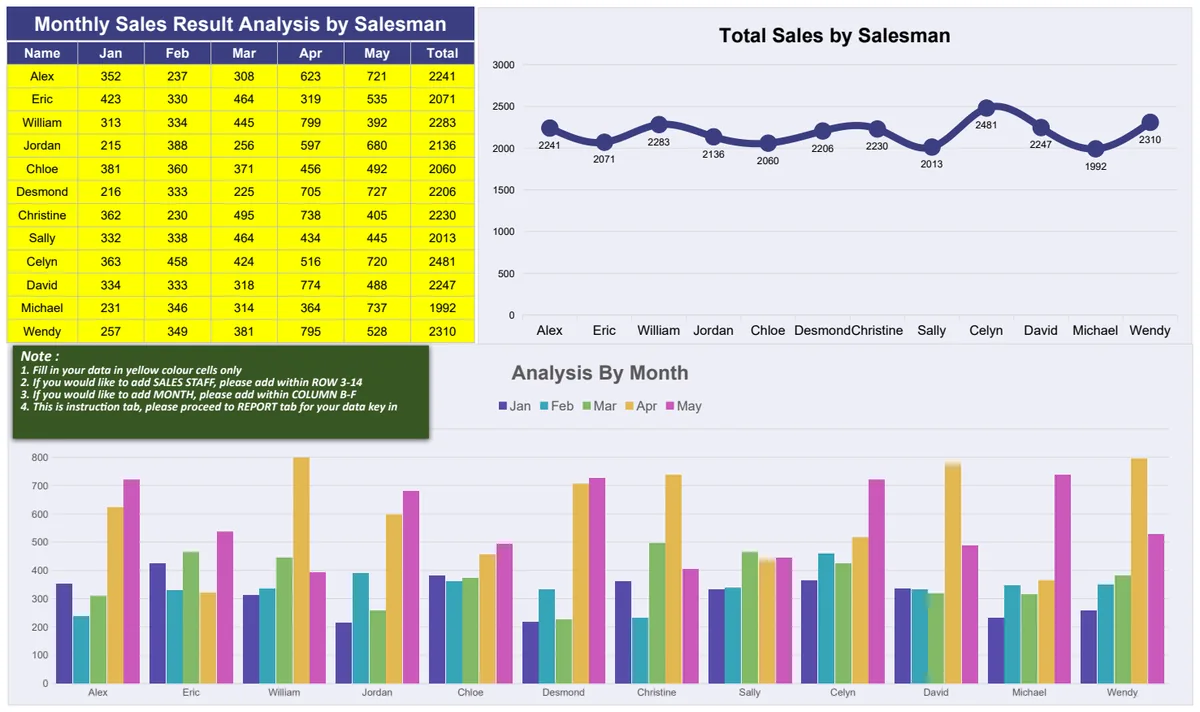
Monthly Sales Result Analysis by Salesman
Track individual salesman performance with monthly sales figures, totals, and visual charts.
- Monthly sales data entry by salesman
- Automatic sum calculations for total sales per person
- Built-in charts for visual performance comparison
 Sales & CRM
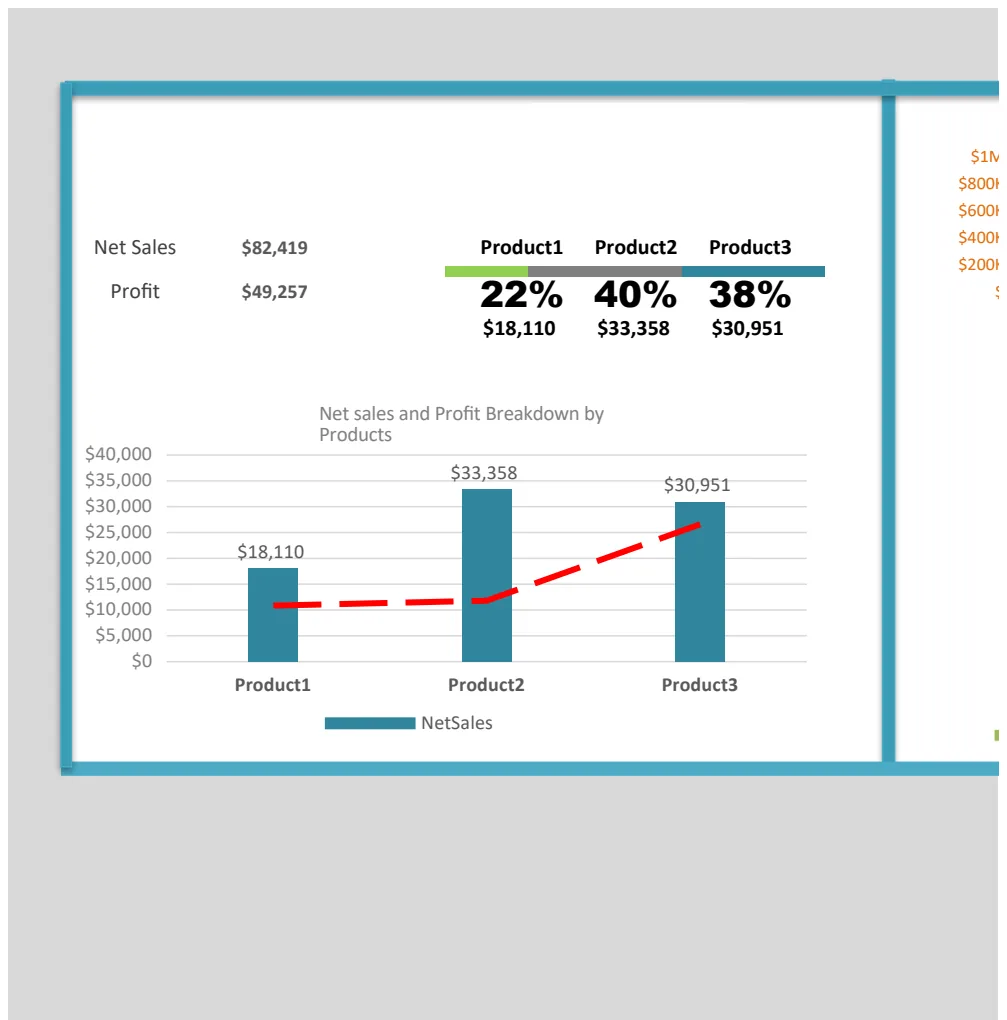
Net Sales & Profit Breakdown Dashboard
Track net sales and profit by product, year, and region with dynamic filtering and visual charts.
- Dynamic drop-down filtering by year and country
- Automated net sales and profit calculations
- Multi-sheet data structure for organization
 Sales & CRM
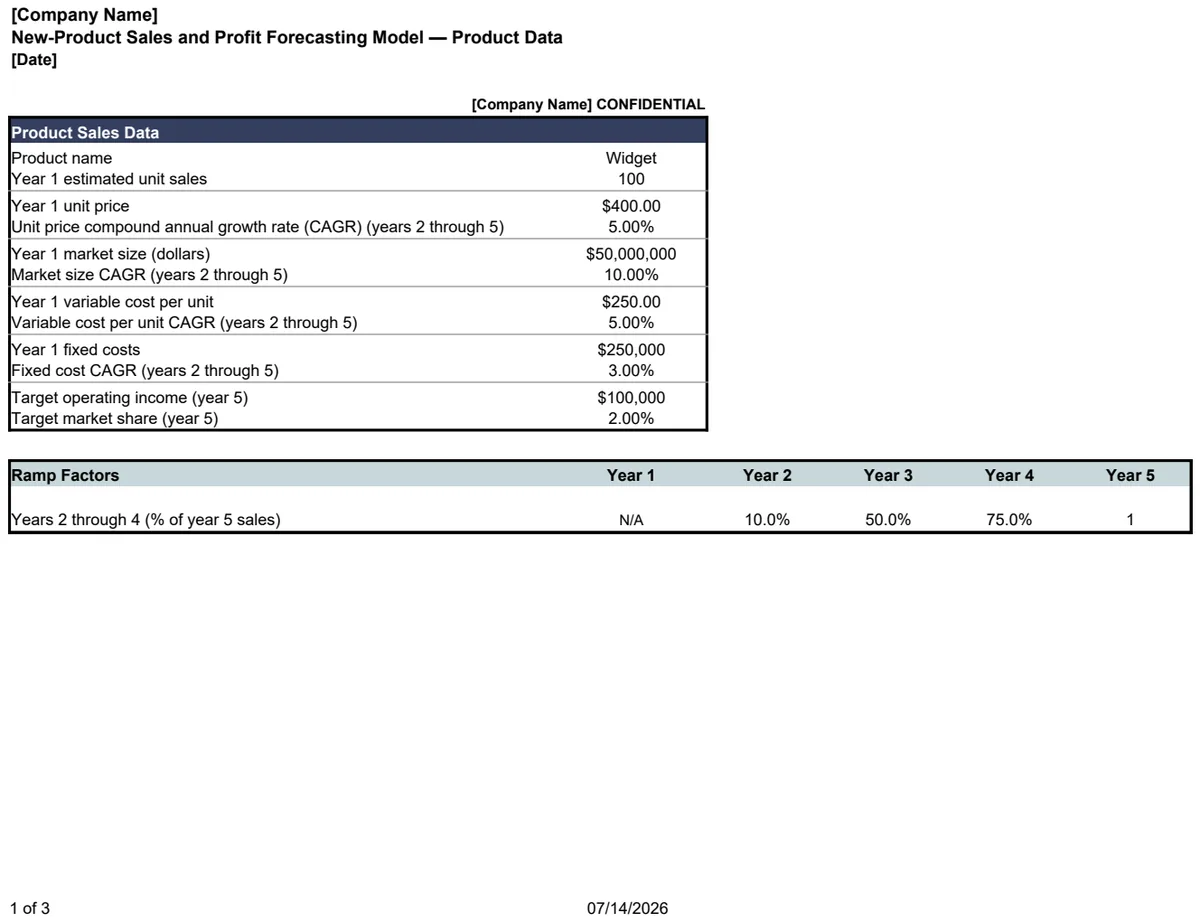
New Product Sales and Profit Forecasting Model
Project sales volume, revenue, and profitability for new products across multiple scenarios.
- Multi-scenario modeling
- Automated profit calculations
- Visual forecast charts
 Sales & CRM
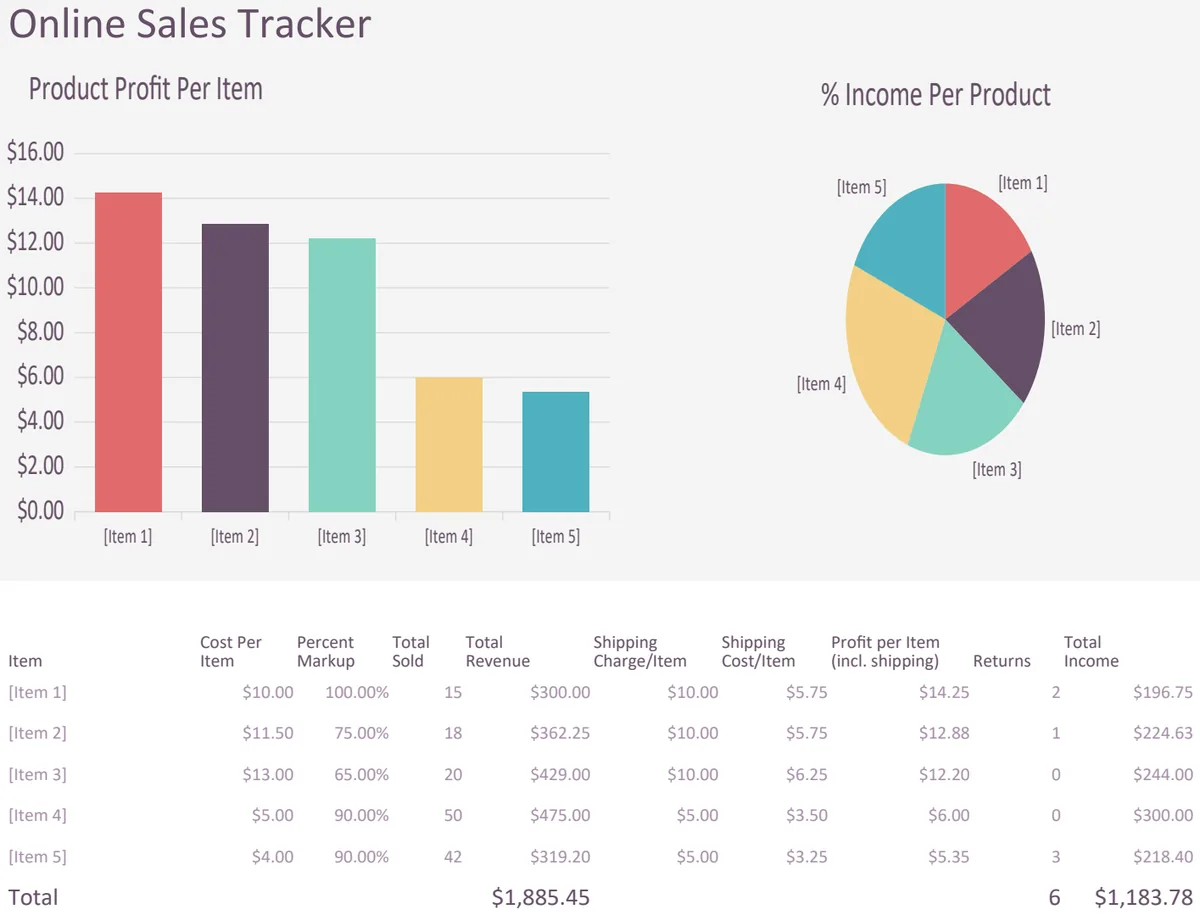
Online Sales Tracker
Track daily online sales with automatic subtotals and visual charts to monitor revenue performance.
- Automatic subtotals with SUBTOTAL function
- Error handling with IFERROR formulas
- Sales performance charts
 Sales & CRM
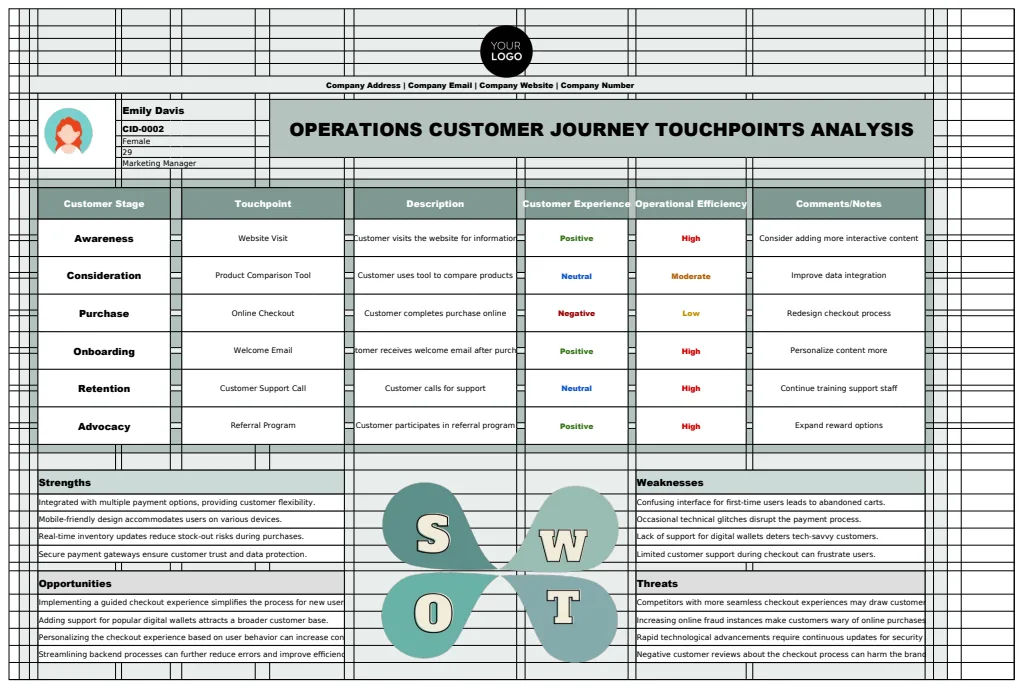
Operations Customer Journey Touchpoints Analysis Template
A comprehensive template for analyzing customer journey touchpoints across operational touchpoints, tracking customer information, and evaluating customer experience metrics.
- Customer database with demographic information
- Automatic customer ID generation using ROW and TEXT functions
- Company contact information integration
 Sales & CRM
Personal Sales Analysis
Track individual sales performance monthly with dynamic reporting and visual analysis.
- Dynamic data lookup by sales rep name
- Monthly sales comparison chart
- Automated calculation with INDEX formula
 Sales & CRM
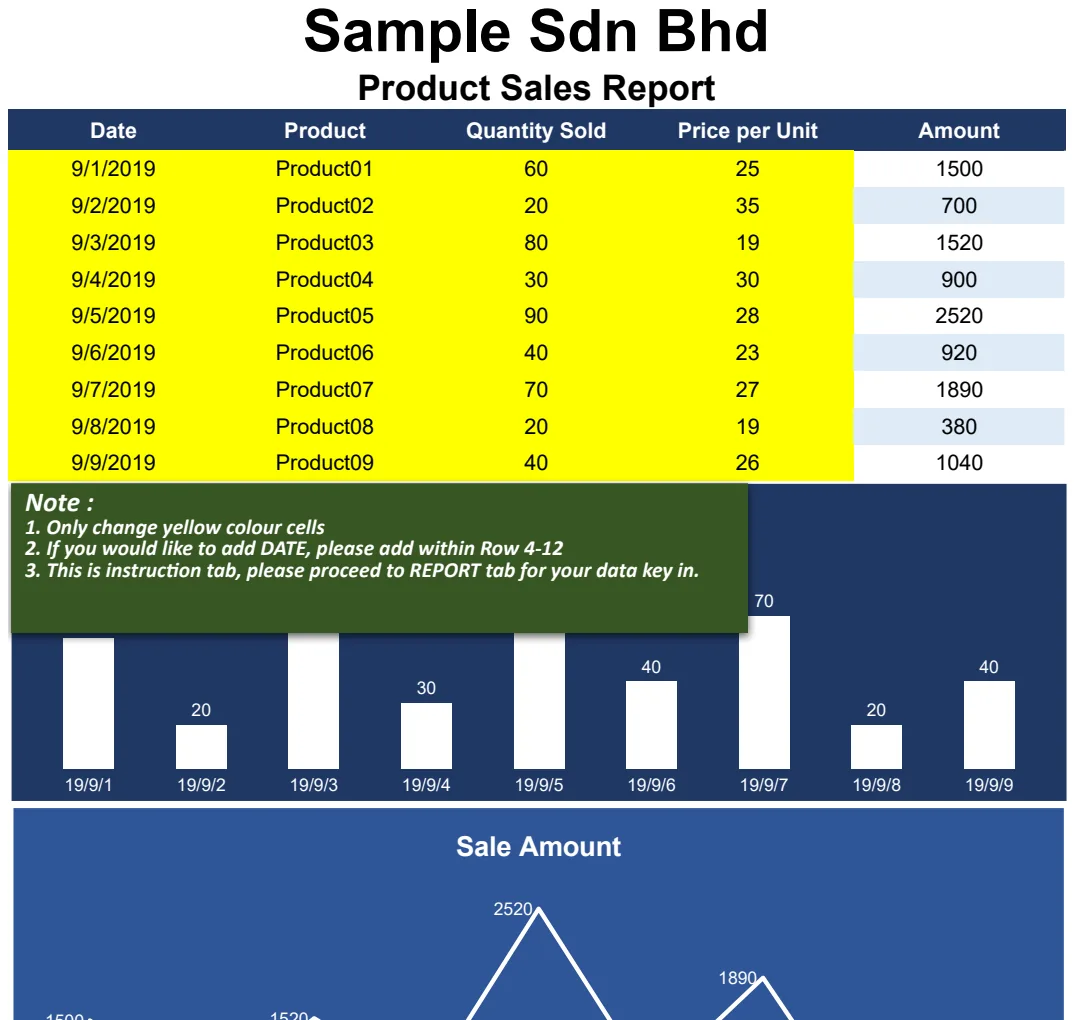
Product Sales Report
Track product sales by quantity, price, and revenue with automatic calculations and charts.
- Date-based sales tracking
- Product-level quantity and pricing capture
- Automatic amount calculations
 Sales & CRM
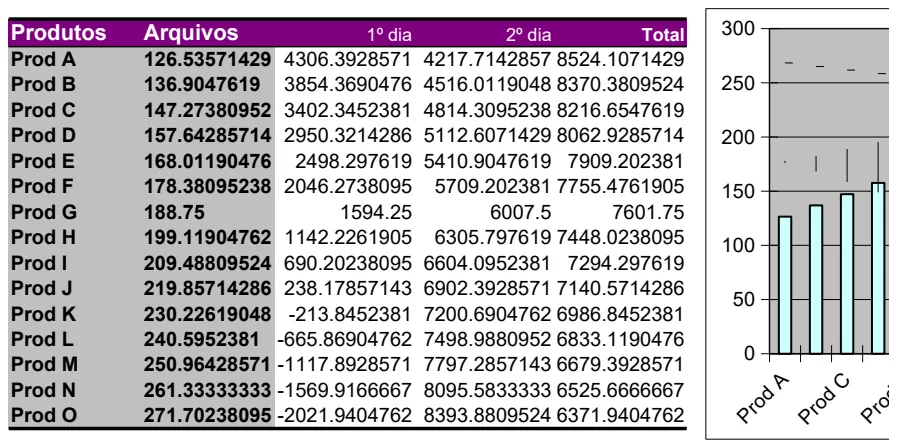
Product Sales Tracker by Day
Track daily product sales across multiple periods with automatic totals and visual charts.
- Automatic daily total calculations
- Multi-product sales comparison
- Built-in charting for visual analysis
 Sales & CRM
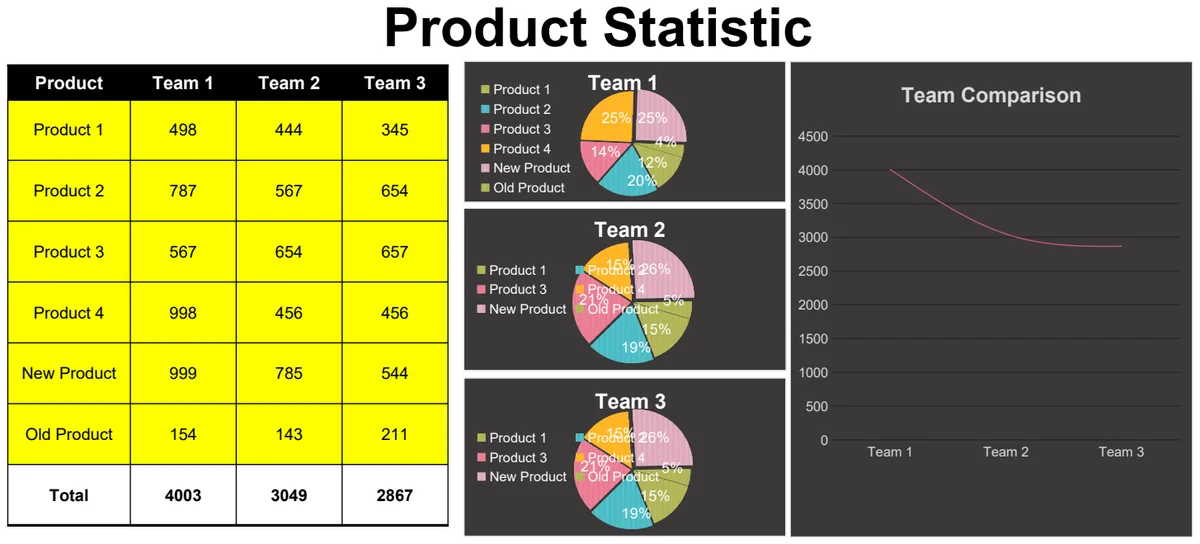
Product Statistic
Track product performance across teams with automatic totals and visual charts.
- Automatic SUM formulas for total calculations
- Multi-team product comparison table
- Built-in chart visualization
 Sales & CRM
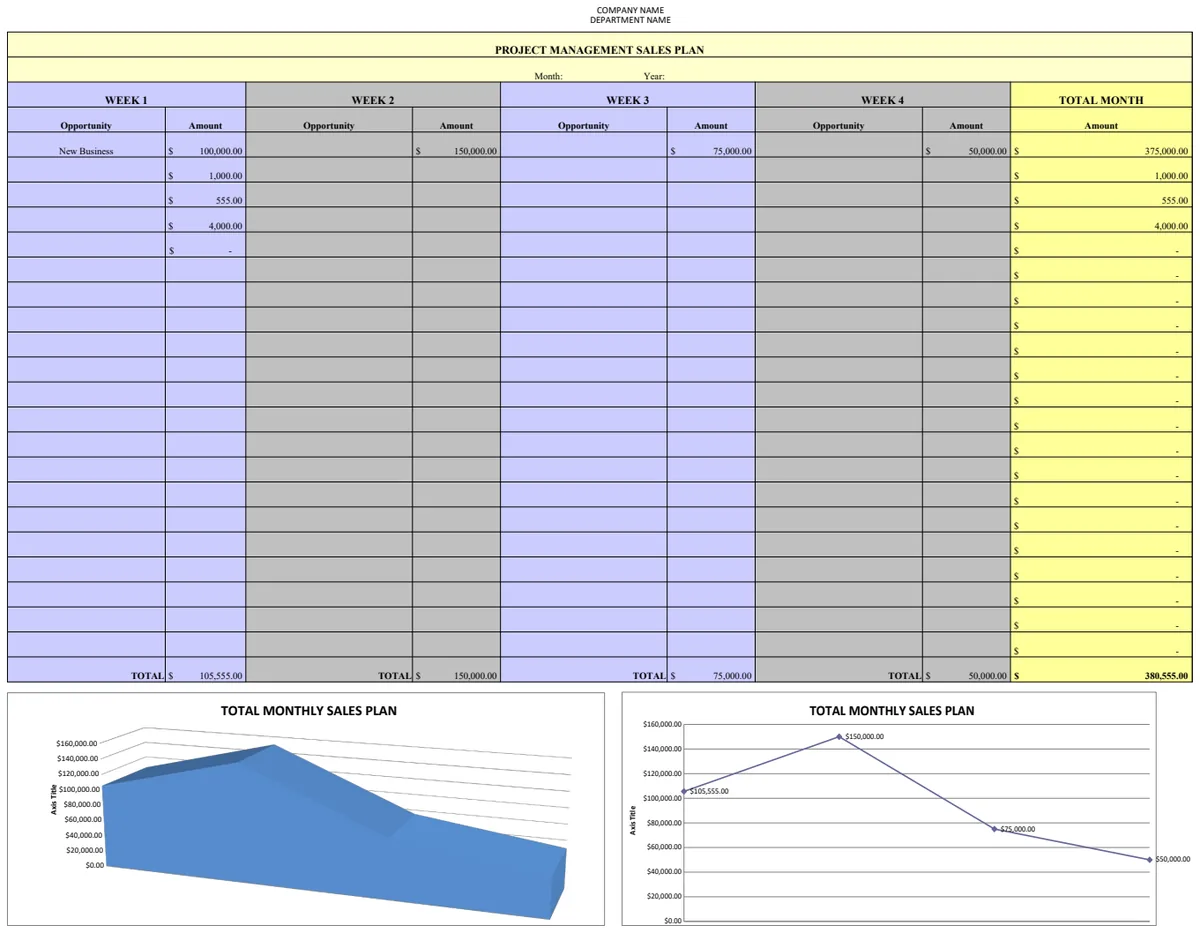
Project Management Sales Plan
Track weekly sales targets and actuals by project with visual progress charts.
- Weekly sales tracking by project
- Target vs. actual comparison
- SUM formulas for automatic totals
 Sales & CRM
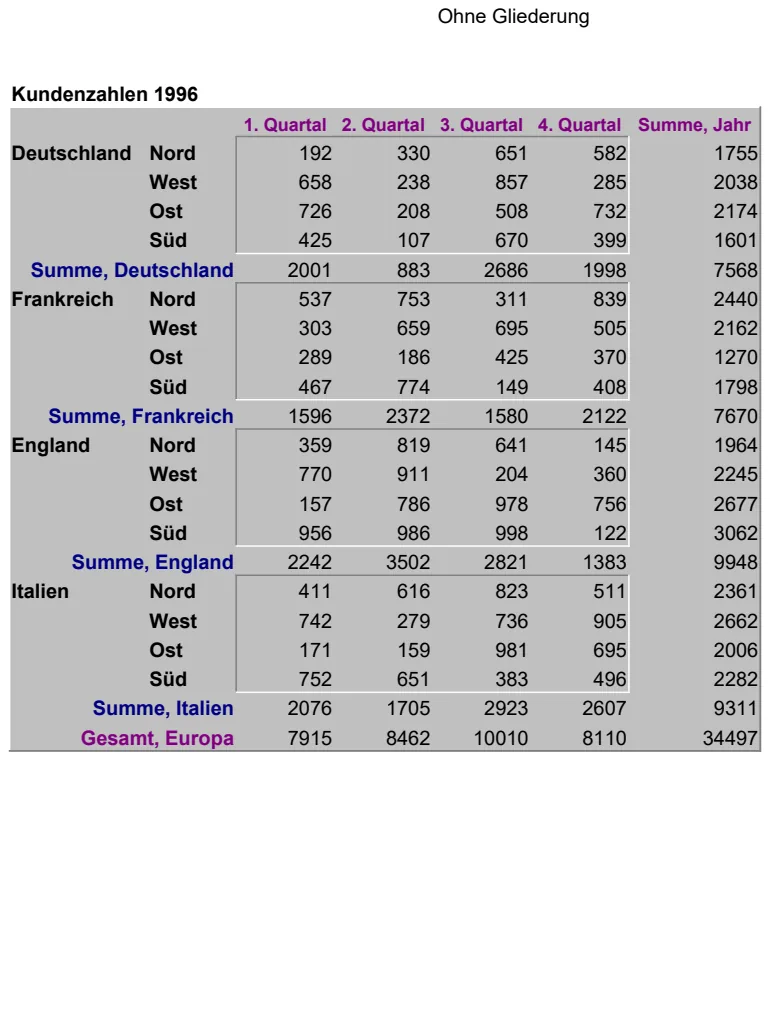
Quarterly Customer Numbers by Region 1996
Track customer count trends across regions and quarters with quarterly summaries.
- Quarterly data structure
- Regional segmentation
- Automatic sum calculations
 Sales & CRM
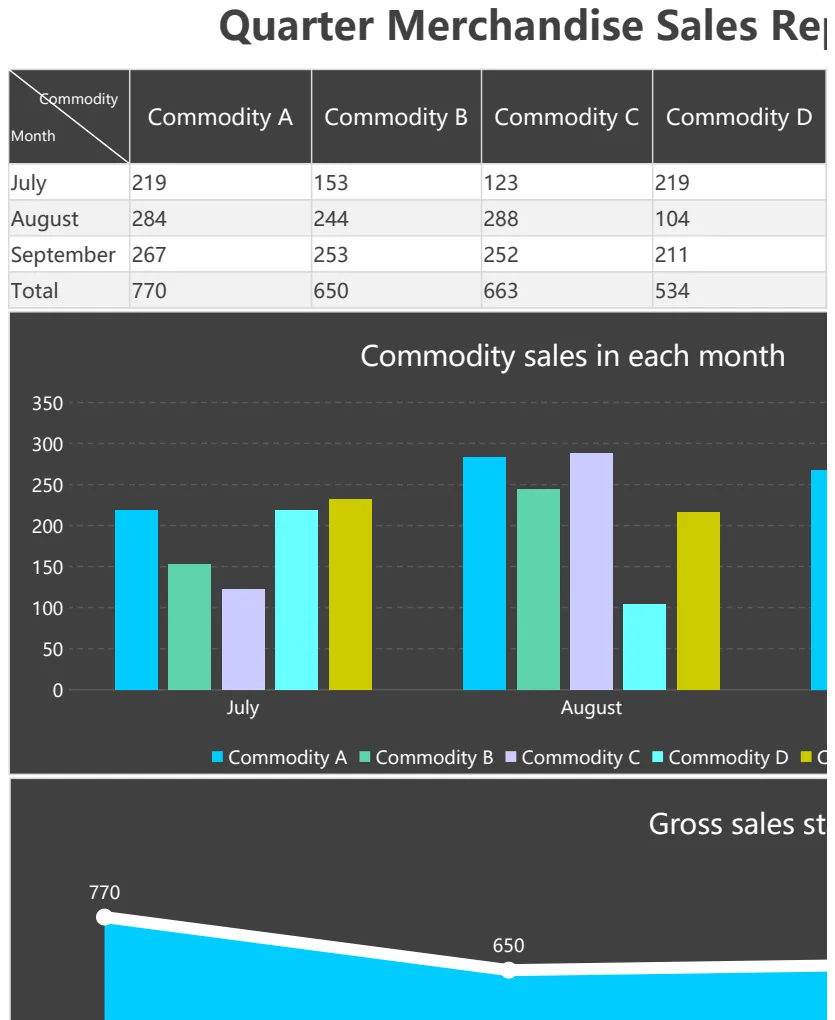
Quarterly Merchandise Sales Report
Track quarterly sales by merchandise category with automatic summation and visual charts.
- Monthly sales breakdown by commodity
- Automatic SUM calculations for totals
- Visual charts for trend analysis
 Sales & CRM
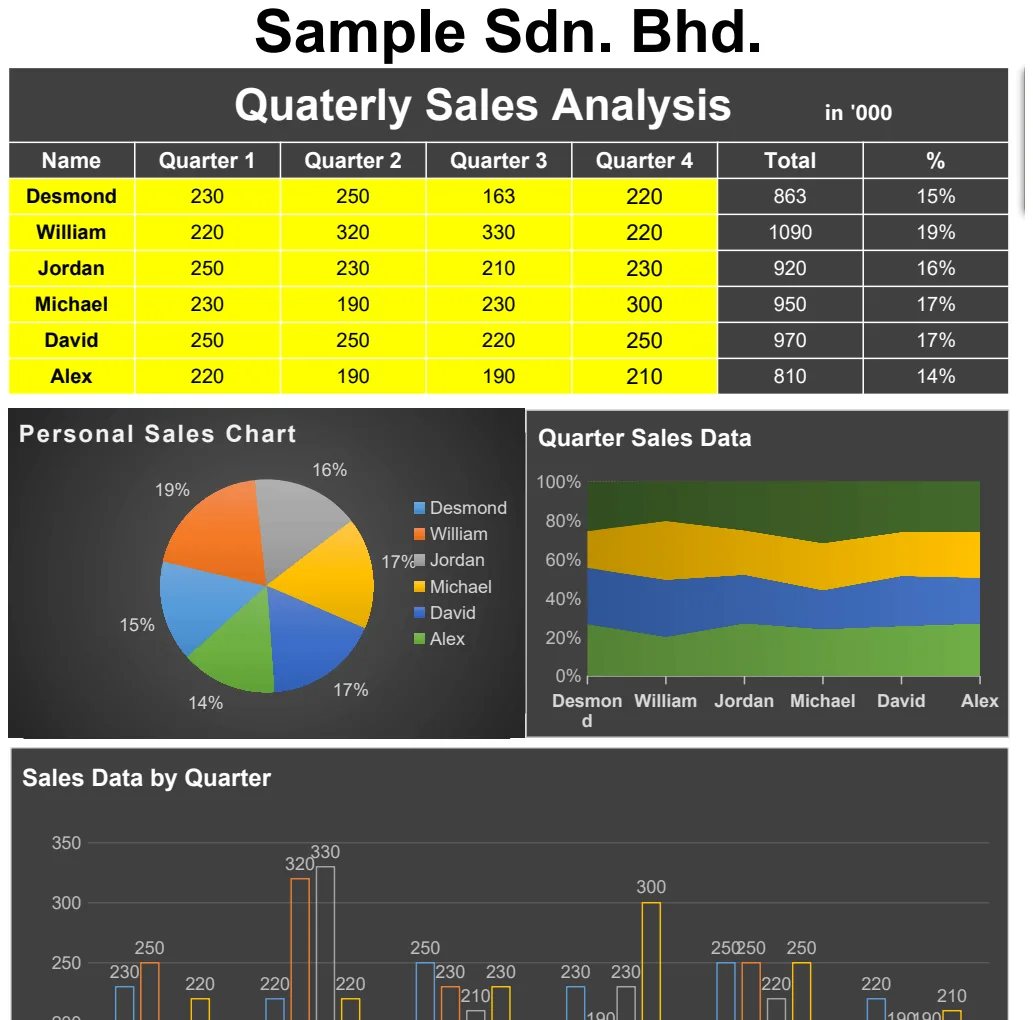
Quarterly Sales Analysis
Track and visualize quarterly sales performance by product or region with charts and automated summaries.
- Quarterly breakdown by sales category or product
- Automated SUM formulas for total calculations
- Built-in charts for visual performance comparison
 Sales & CRM
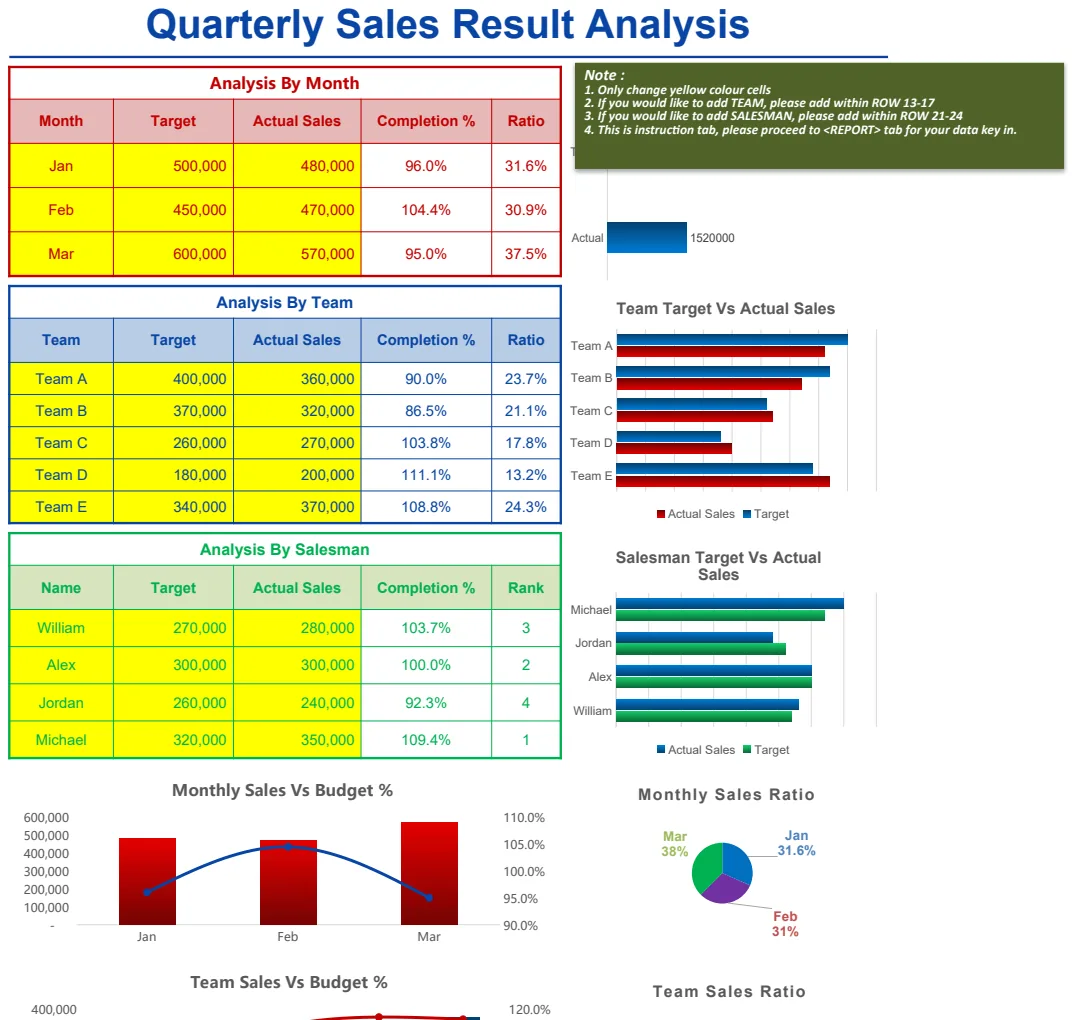
Quarterly Sales Result Analysis
Track monthly sales performance against targets with completion rates and visual comparisons.
- Month-by-month target vs actual comparison
- Automatic completion percentage calculations
- Performance ranking by month