Category
Sales & CRM
Templates for forecasting sales, tracking leads, and analyzing performance.
186 templates

 Sales & CRM
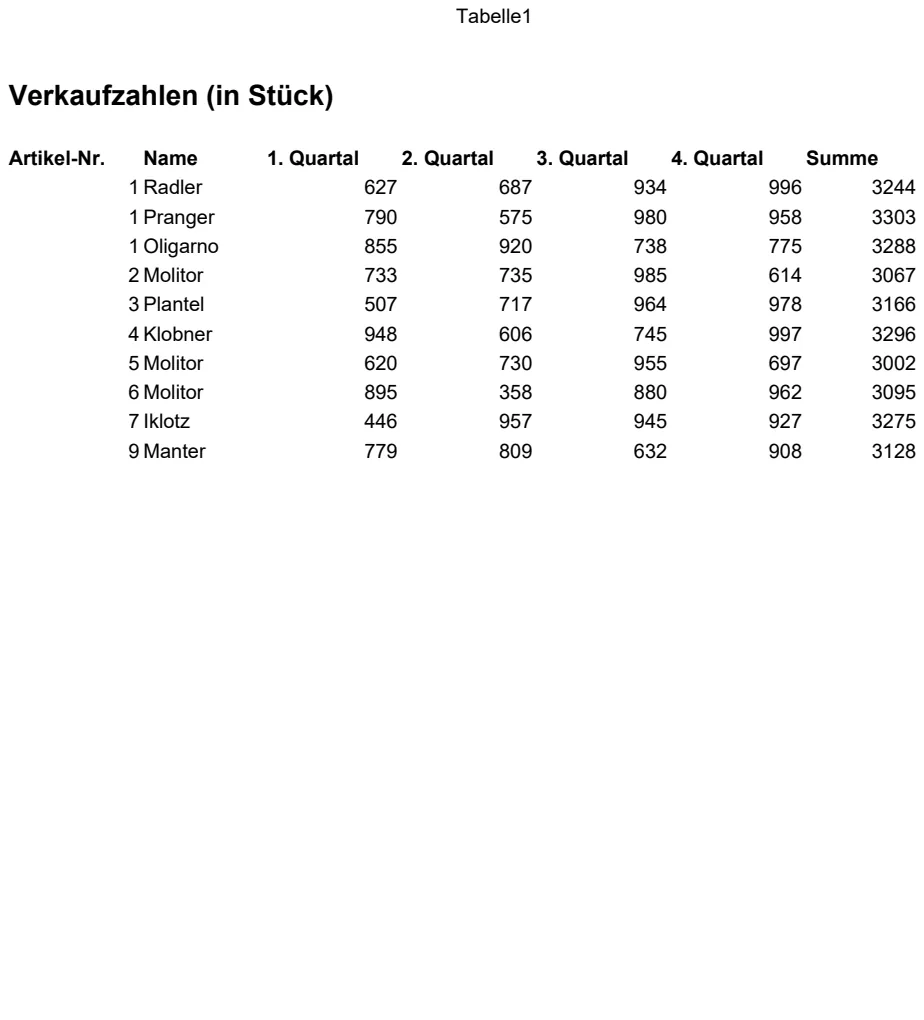
Quarterly Sales Volume Tracker
Track product sales units by quarter with automatic totals to monitor performance trends.
- Product ID and name columns
- Quarterly sales volume columns (Q1-Q4)
- Automatic SUM formulas for total calculations
 Sales & CRM
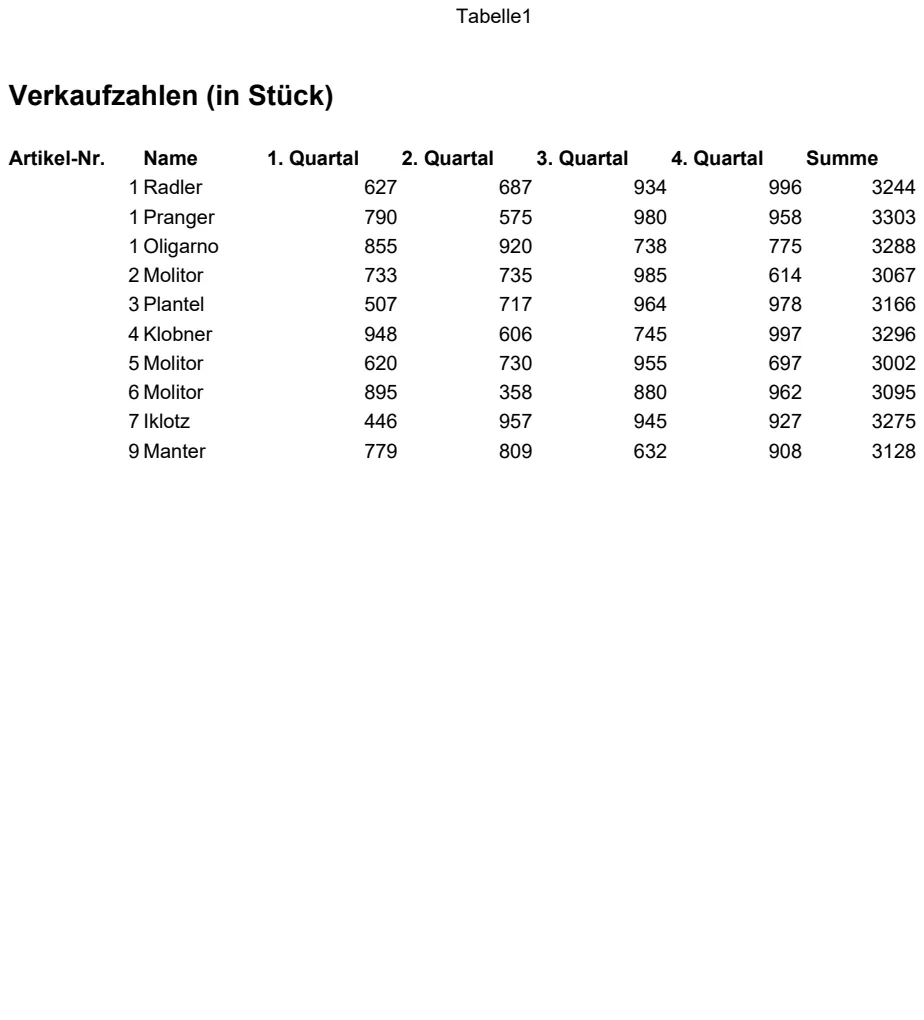
Quarterly Sales Volume Tracker
Track product sales by quarter with automatic totals to monitor performance across periods.
- Product-based sales organization
- Four quarterly columns for easy period comparison
- Automatic SUM formulas for total calculations
 Sales & CRM
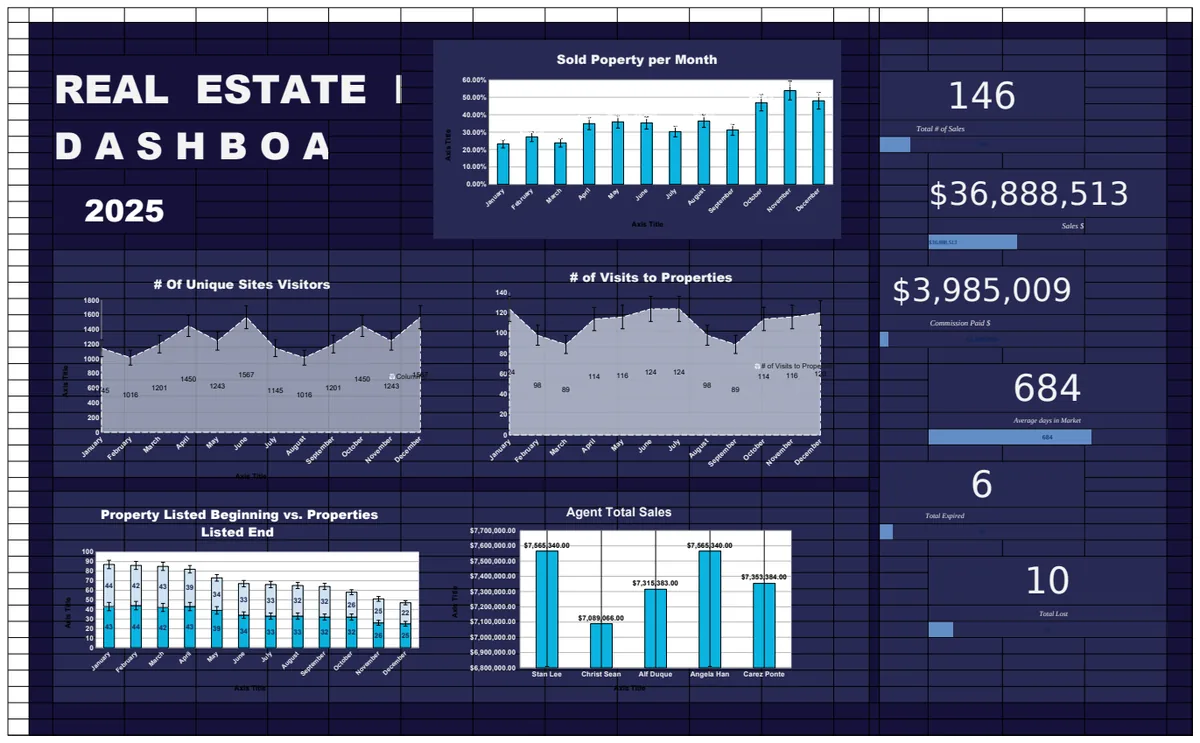
Real Estate KPI Dashboard Template
Comprehensive dashboard tracking key performance indicators for real estate operations including property listings, visitor metrics, and sales performance.
- Multi-sheet data aggregation
- Automated KPI calculations
- Array formulas for dynamic updates
 Sales & CRM
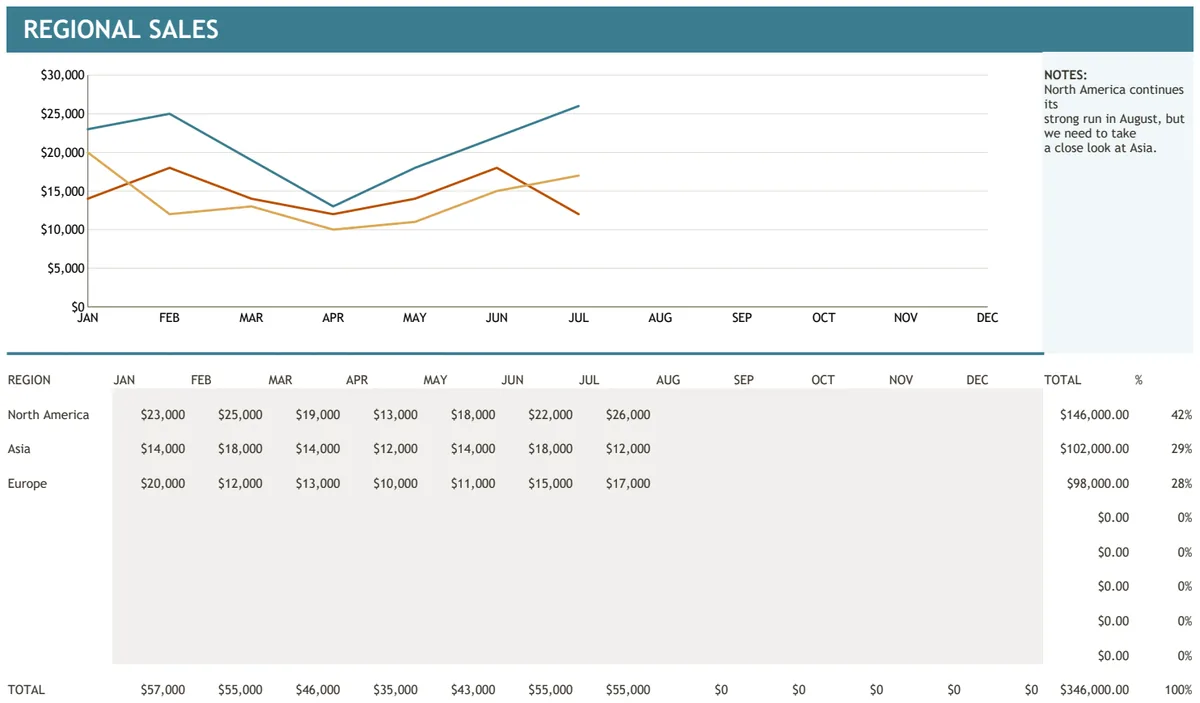
Regional Sales Chart
Track and visualize sales performance by region across monthly periods with automatic totals.
- Automated SUBTOTAL calculations for regions
- SUM formulas for monthly totals
- Pre-built sales chart visualization
 Sales & CRM
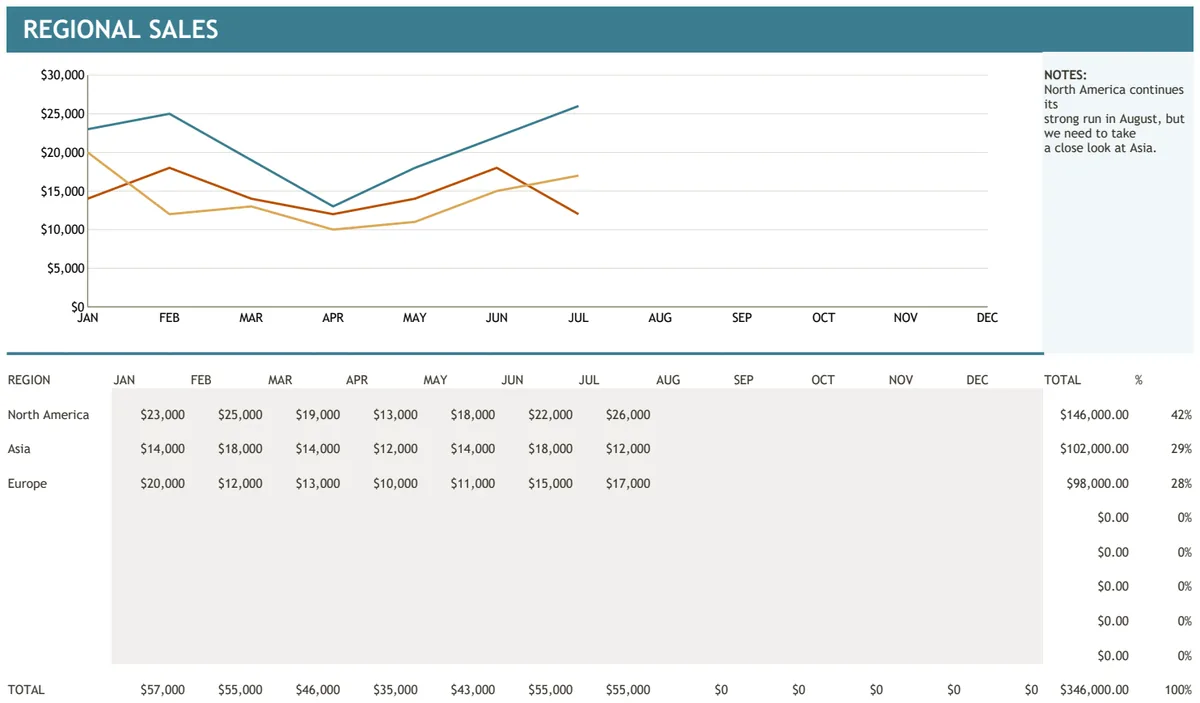
Regional Sales Chart
Track and visualize regional sales performance across months with automatic subtotals and charting.
- Monthly sales data by region
- Automatic subtotal calculations
- Built-in sales chart visualization
 Sales & CRM
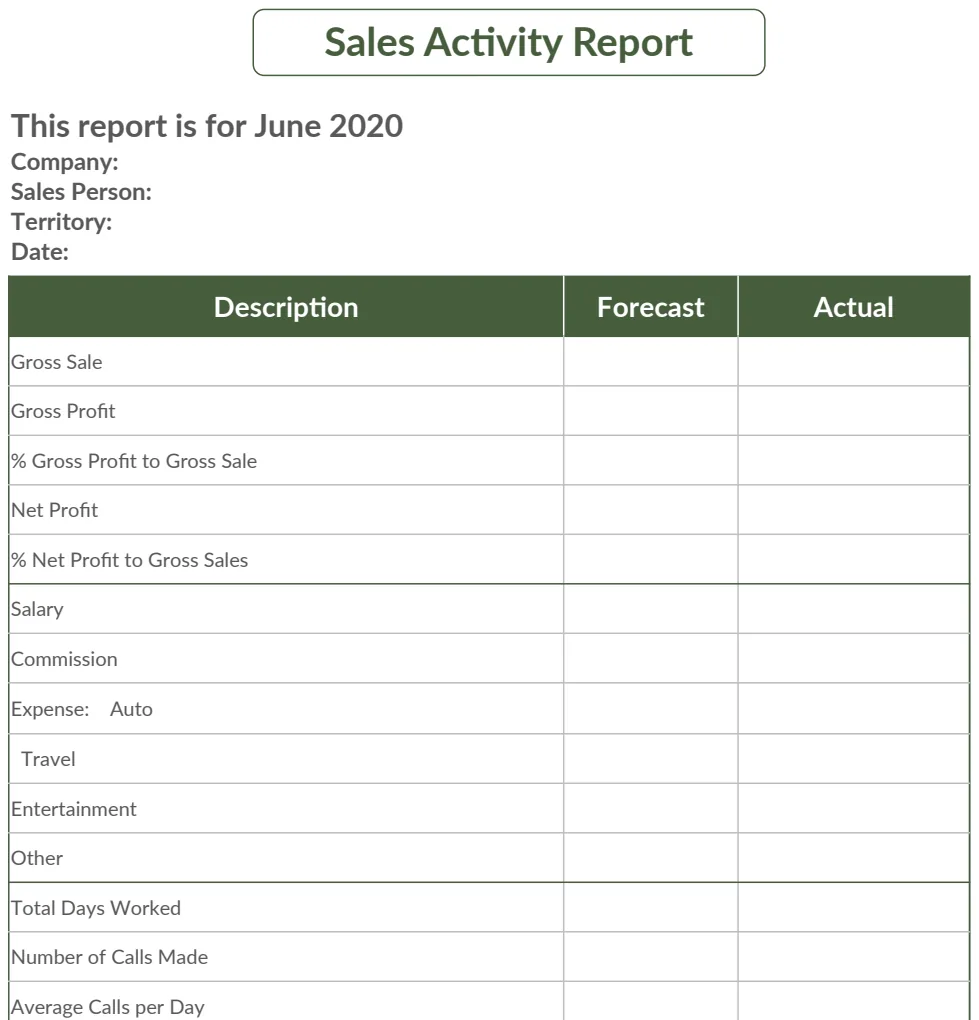
Sales Activity Report Sample Template
Track and summarize sales activities by person for monthly reporting and performance analysis.
- Monthly date header
- Sales person identification
- Company field
 Sales & CRM
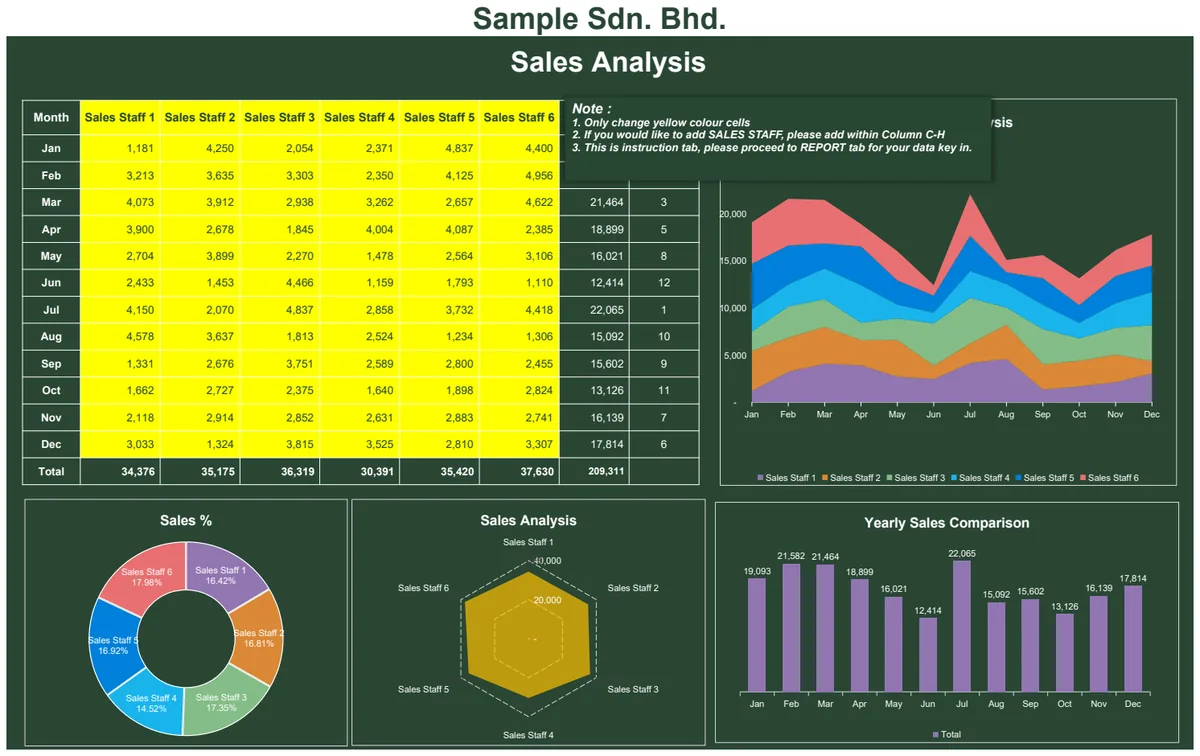
Sales Analysis
Track and compare individual sales staff performance month-by-month with rankings and visual charts.
- Automatic staff ranking by sales volume
- Monthly sales comparison columns
- SUM formulas for total calculations
 Sales & CRM
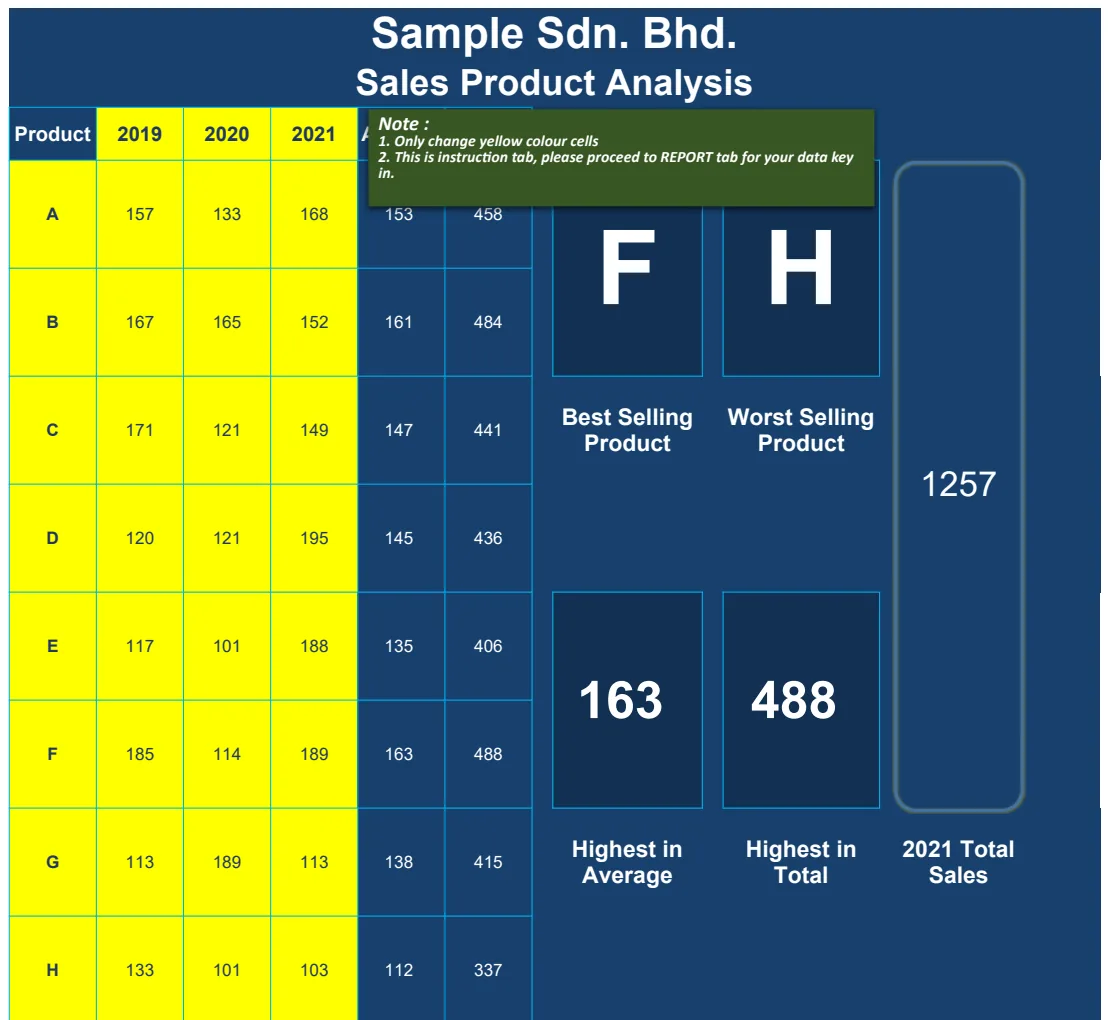
Sales Analysis By Product
Track product performance across years with comparative sales data and visual insights.
- Multi-year sales data comparison (2019-2021)
- Automatic calculation of averages and totals
- MIN/MAX functions to identify best and worst performers
 Sales & CRM
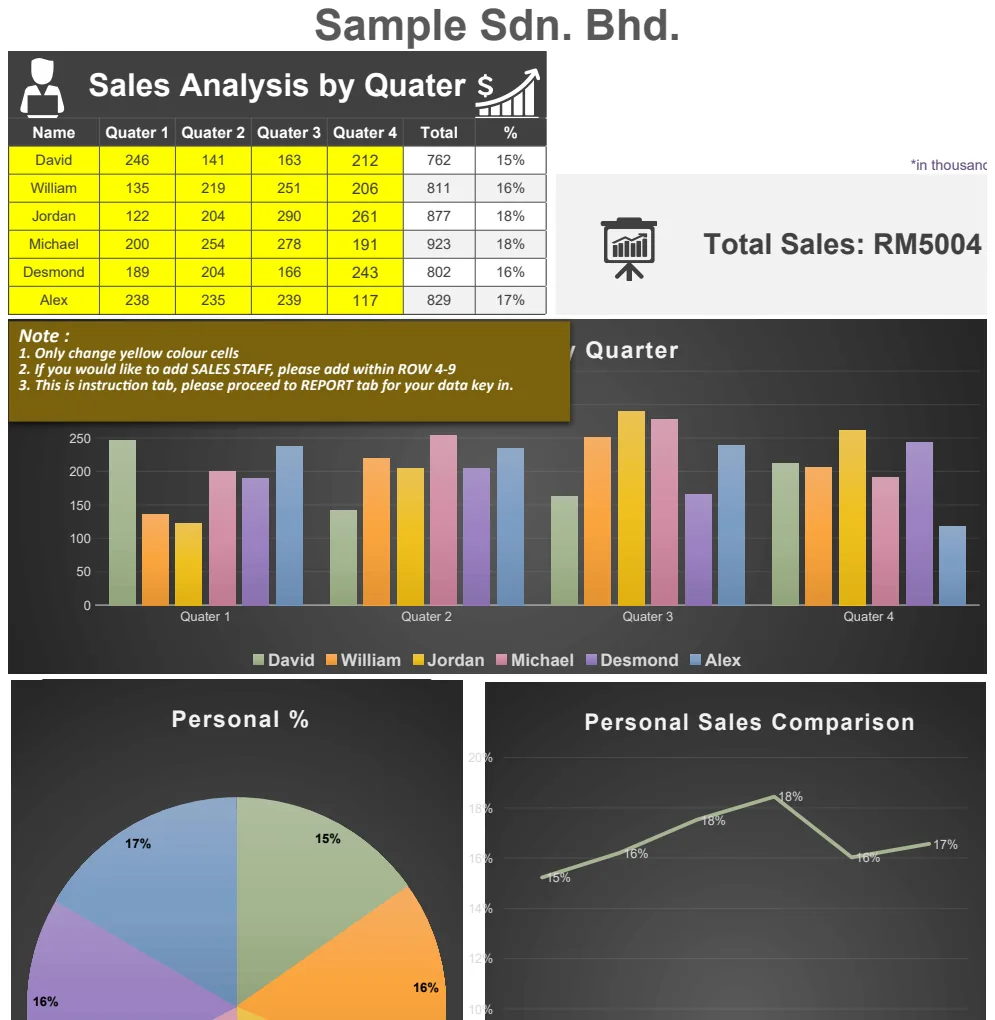
Sales Analysis by Quarter
Track and visualize quarterly sales performance with automated totals and visual charts.
- Quarterly sales breakdown by product or region
- Automatic total calculations with SUM functions
- Built-in charts for visual trend analysis
 Sales & CRM
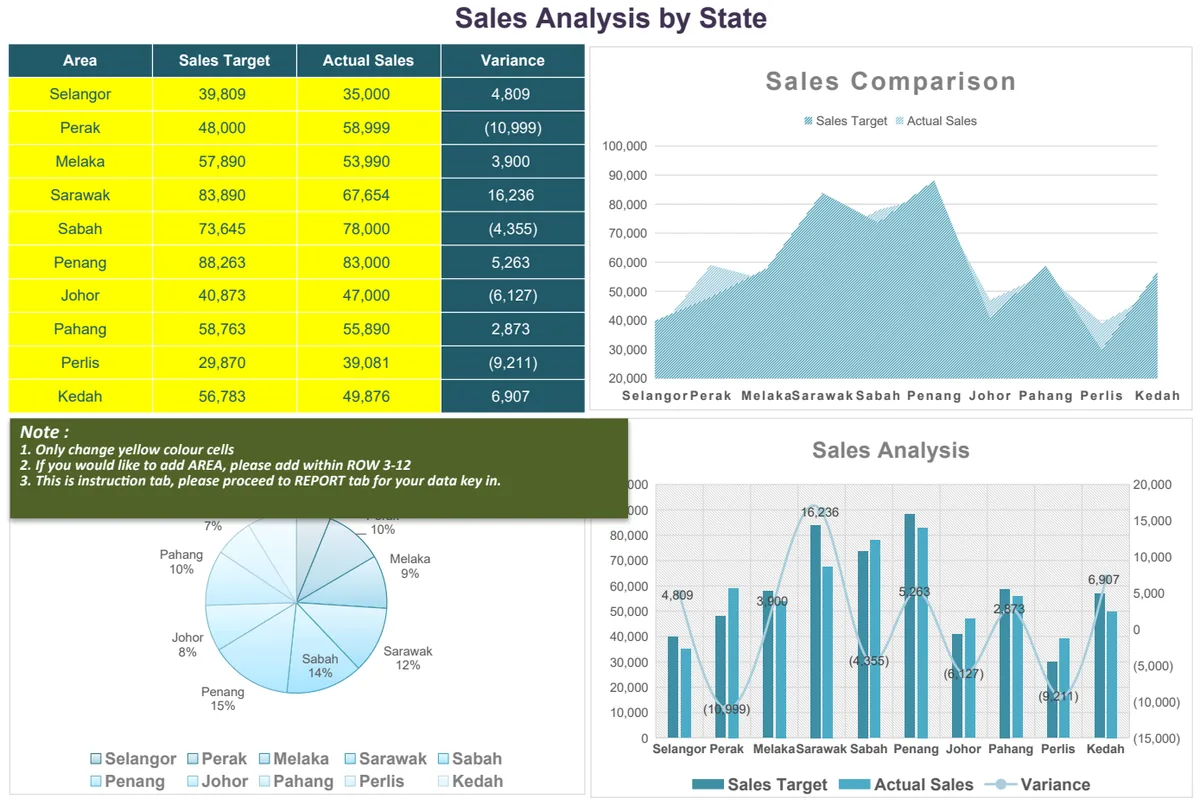
Sales Analysis by State
Track regional sales performance against targets with variance analysis and visual charts.
- Variance calculation (Actual vs Target)
- State-by-state sales comparison
- Auto-generated performance charts
 Sales & CRM
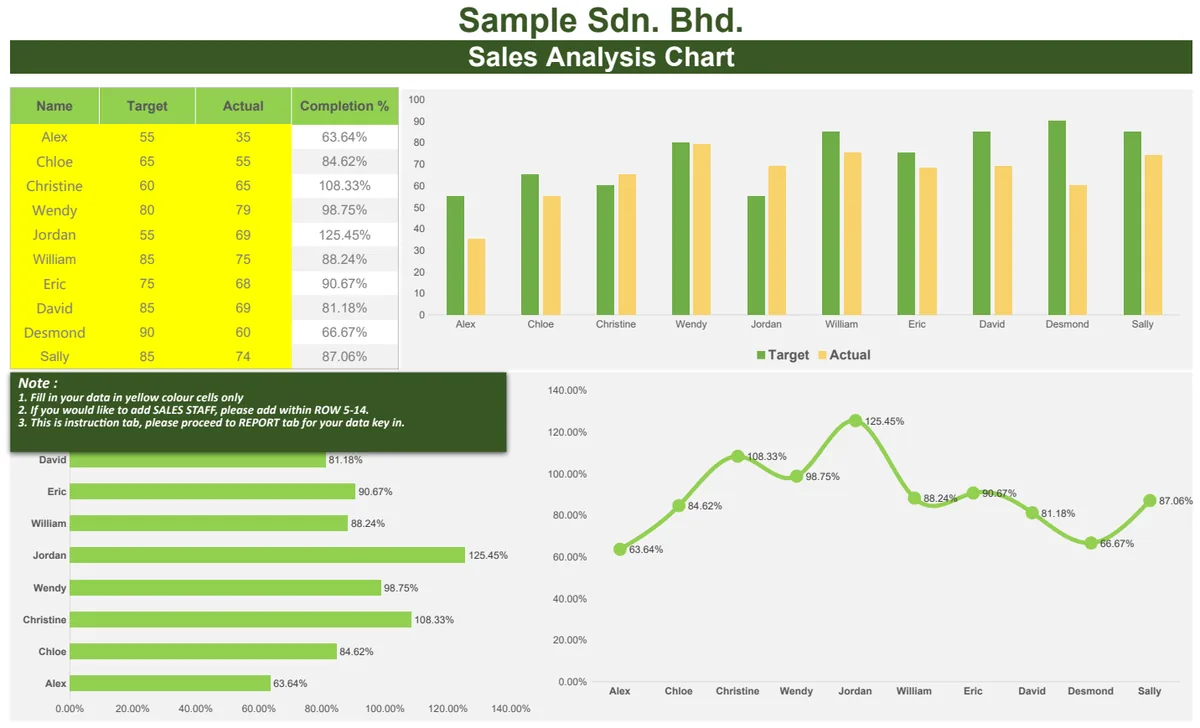
Sales Analysis Chart
Track sales performance against targets with completion percentages and visual charts.
- Target vs. Actual comparison columns
- Automatic completion percentage calculation
- Built-in performance charts
 Sales & CRM
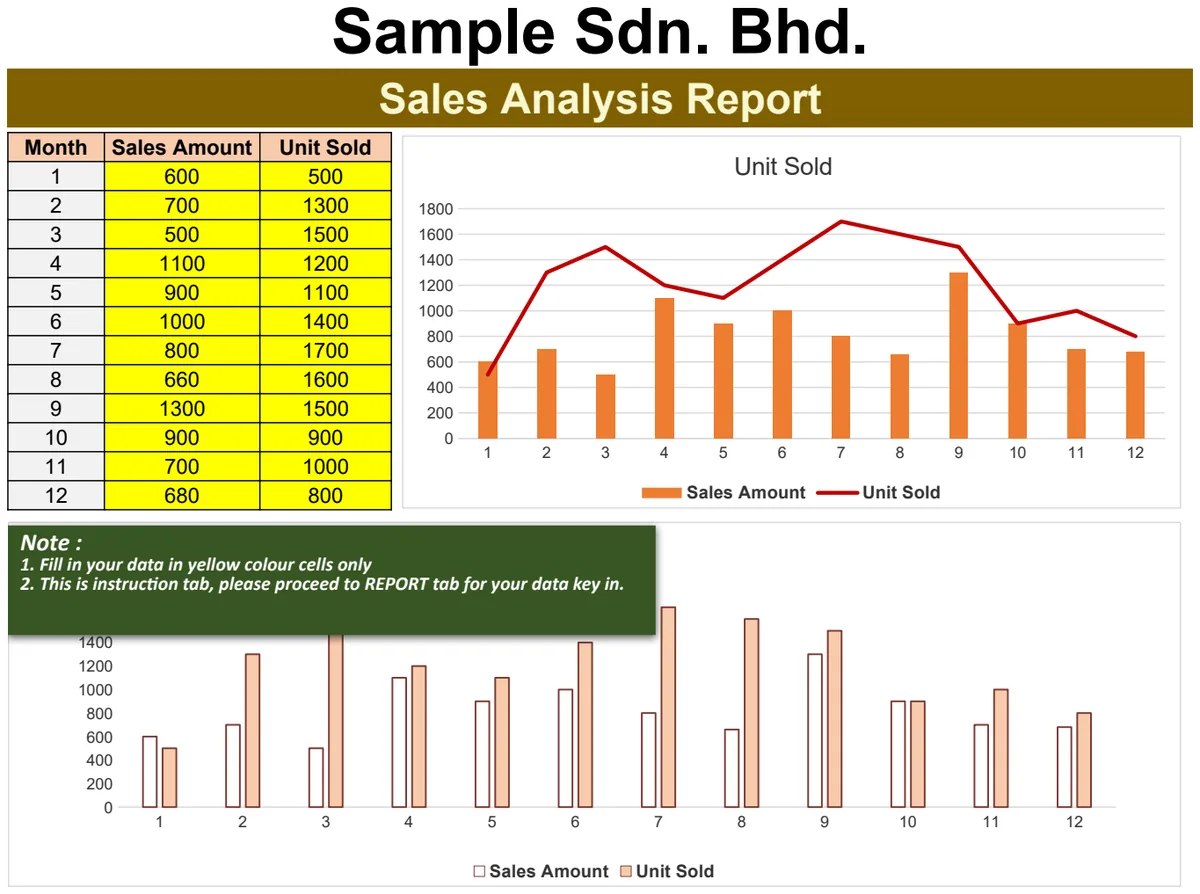
Sales Analysis Report
Track monthly sales performance with visual charts showing revenue and units sold by period.
- Monthly sales data entry
- Sales amount tracking
- Units sold tracking
 Sales & CRM
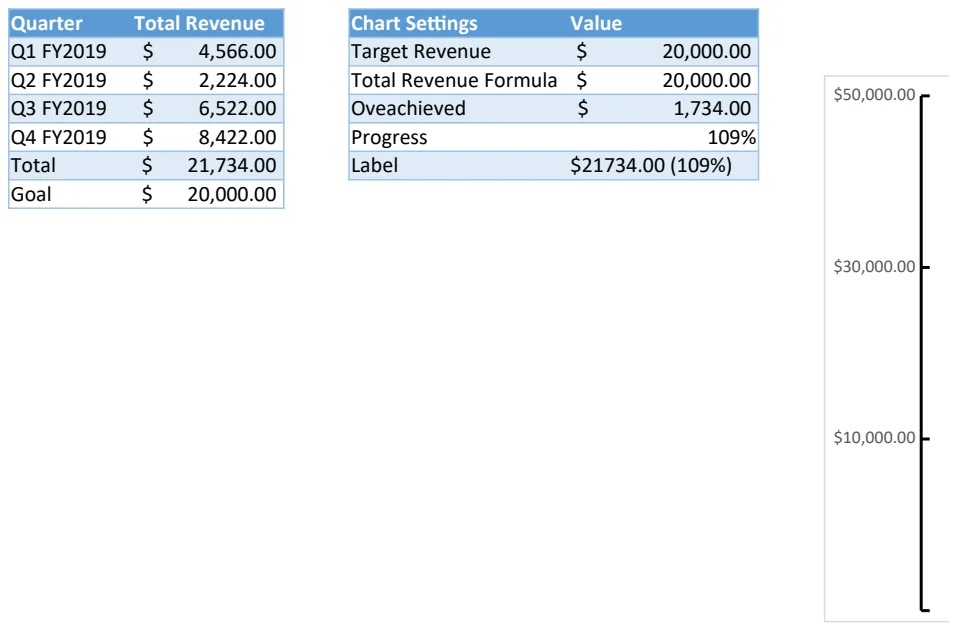
Sales and Revenue Thermometer Chart
Track quarterly sales performance against revenue targets with visual thermometer gauge.
- Thermometer gauge visualization
- Quarterly revenue comparison
- Target vs. actual revenue display
 Sales & CRM
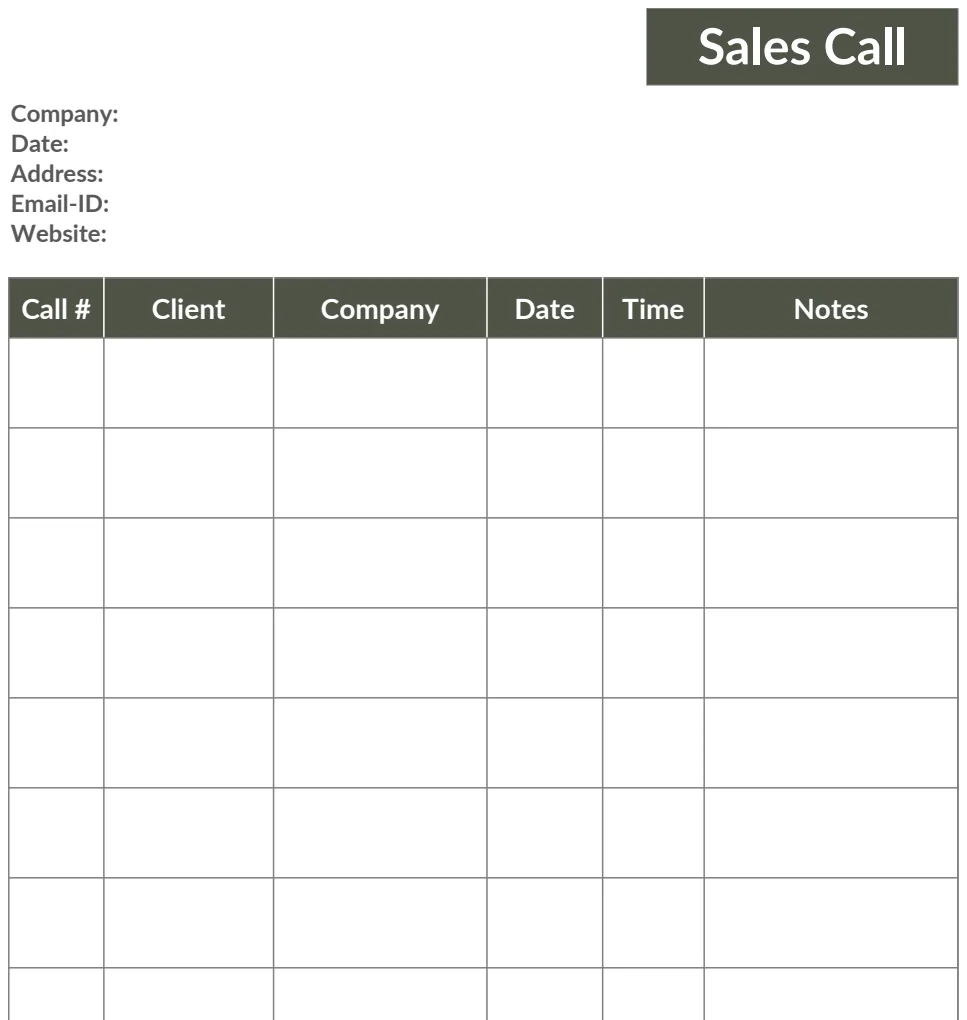
Sales Call Log
Track every sales call with company details, dates, and outcomes to build accountability and improve follow-up.
- Company name field for prospect identification
- Call date tracking for timeline visibility
- Address field for location context
 Sales & CRM
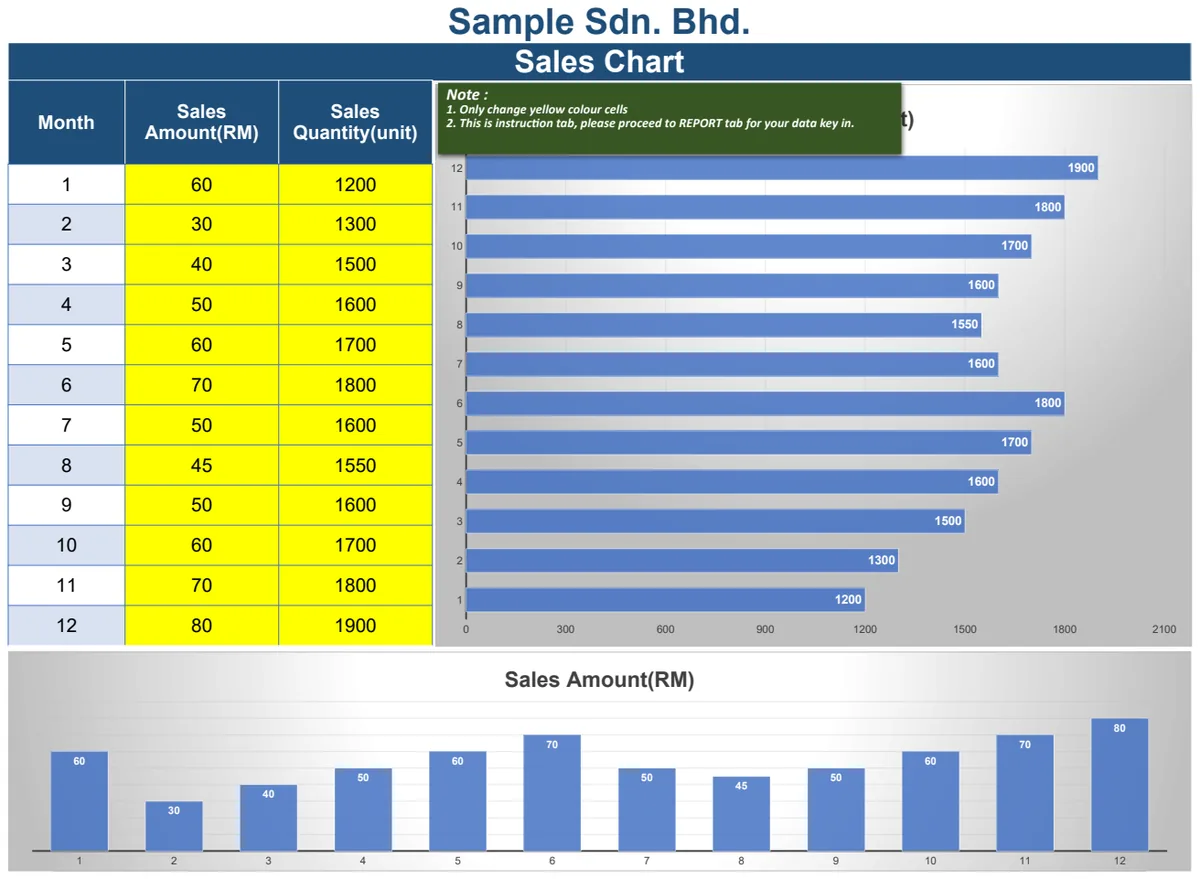
Sales Chart
Track monthly sales performance by revenue and quantity with built-in charting.
- Monthly sales amount tracking (RM)
- Unit quantity sold tracking
- Pre-built sales charts
 Sales & CRM
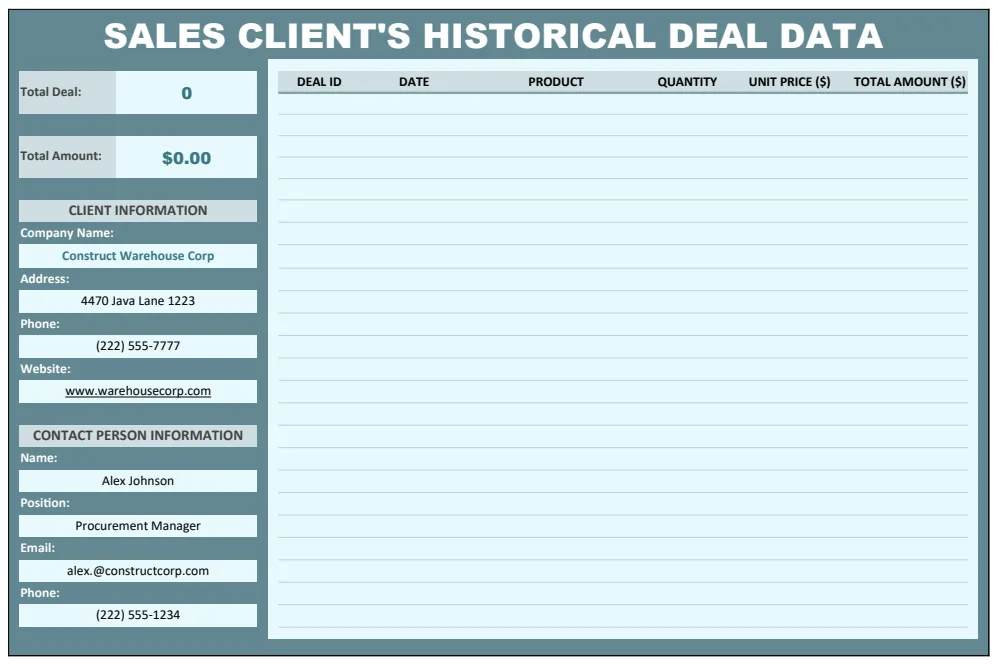
Sales Client's Historical Deal Data Template
Track and analyze historical sales deals and client information with automated deal tracking, client records, and product management.
- Automatic deal counting formula
- Sum calculations for total deal amounts
- Auto-generated deal IDs with sequential numbering
 Sales & CRM
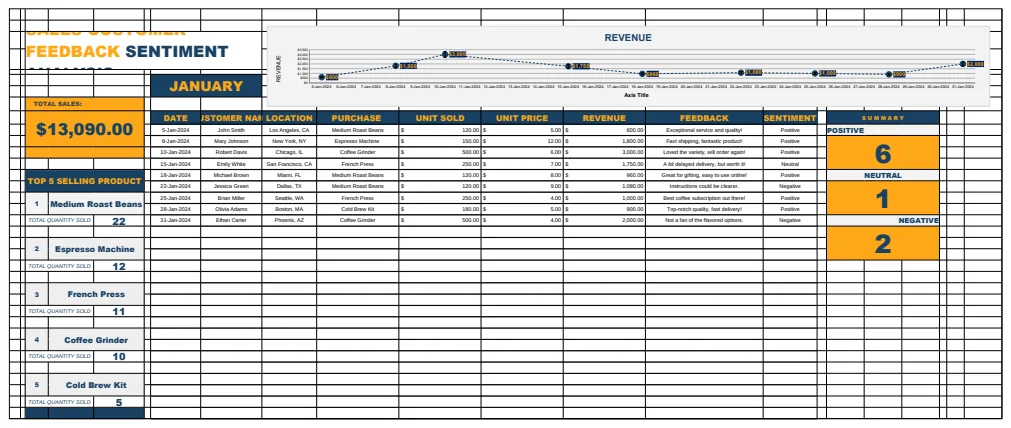
Sales Customer Feedback Sentiment Analysis Template
Track customer feedback and sentiment alongside sales data to analyze purchase patterns and customer satisfaction trends.
- Customer feedback and sentiment tracking
- Sales transaction logging with revenue calculations
- Month-based date grouping and analysis
 Sales & CRM
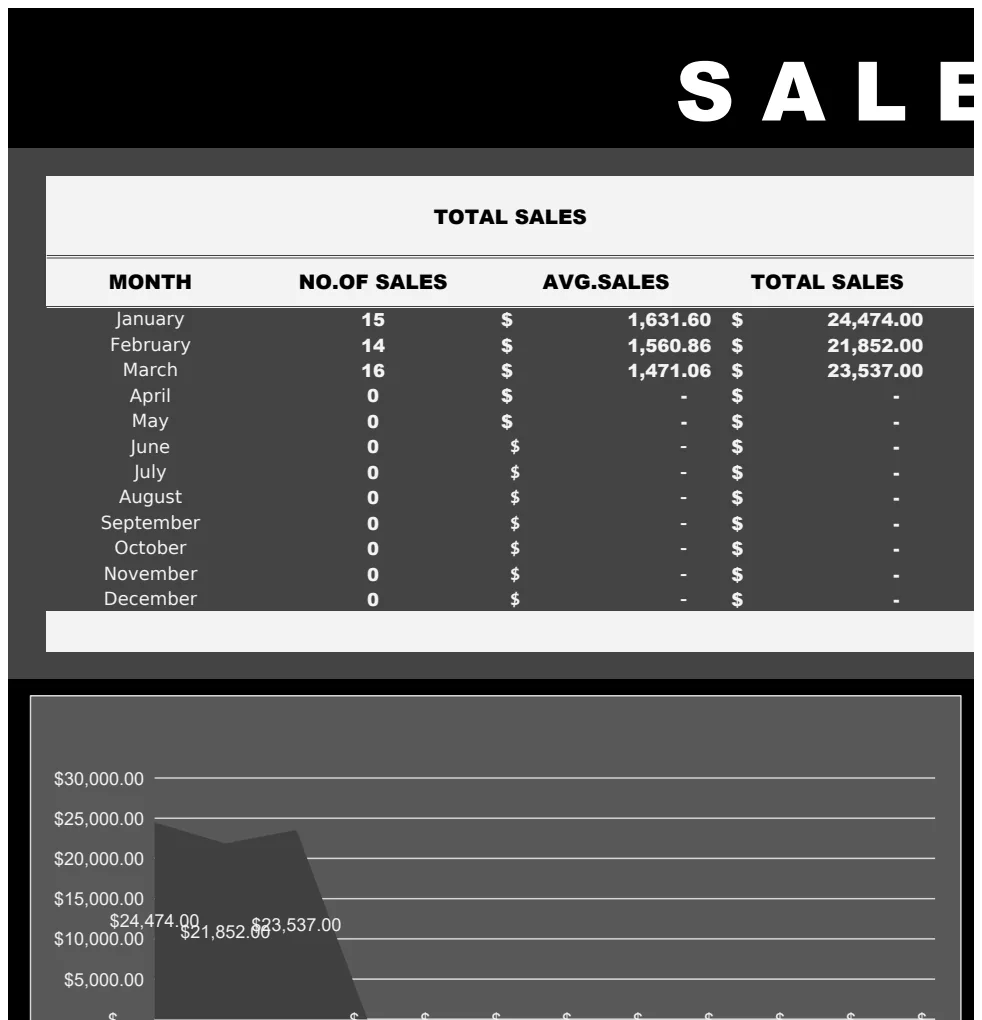
Sales Dashboard Template
A comprehensive sales tracking and dashboard template featuring real-time sales metrics, commission calculations, and performance analytics across multiple sales managers and product types.
- Dynamic dashboard with key performance indicators
- Automated commission calculations
- Monthly sales summaries and aggregations
 Sales & CRM
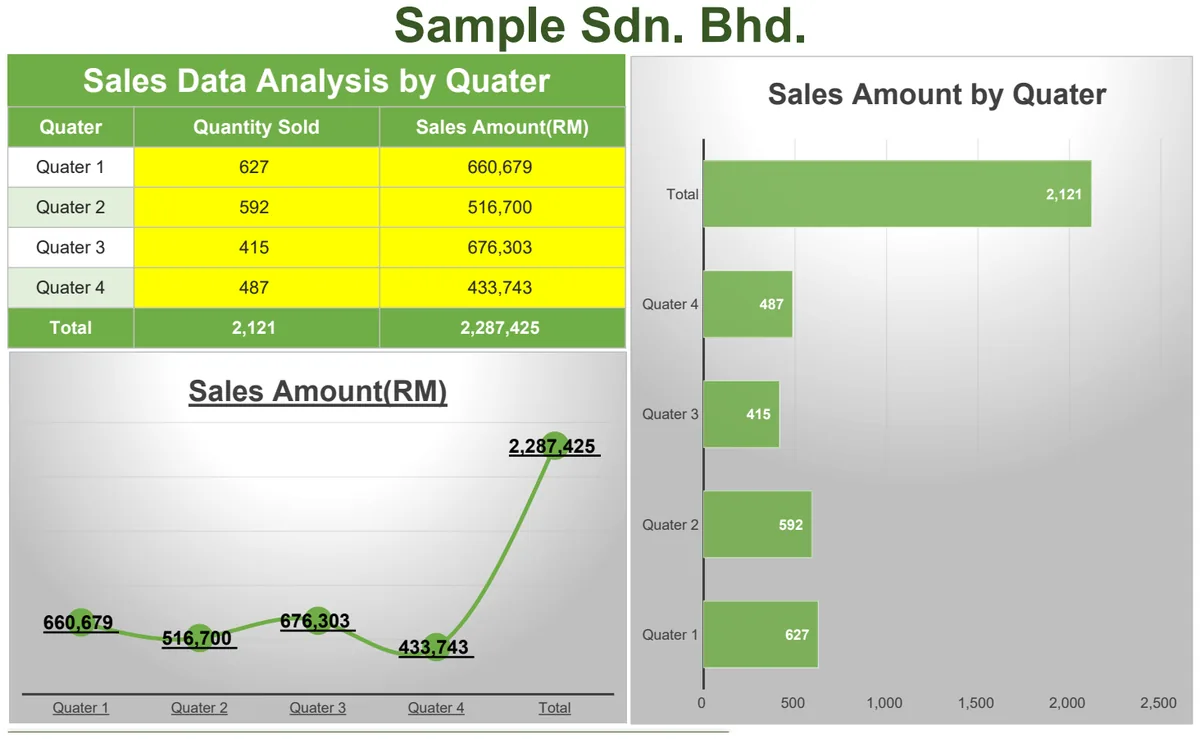
Sales Data Analysis by Quarter
Track quarterly sales performance with quantity sold and revenue totals.
- Quarterly sales data entry
- Automated SUM calculations for totals
- Sales amount tracking in RM currency
 Sales & CRM
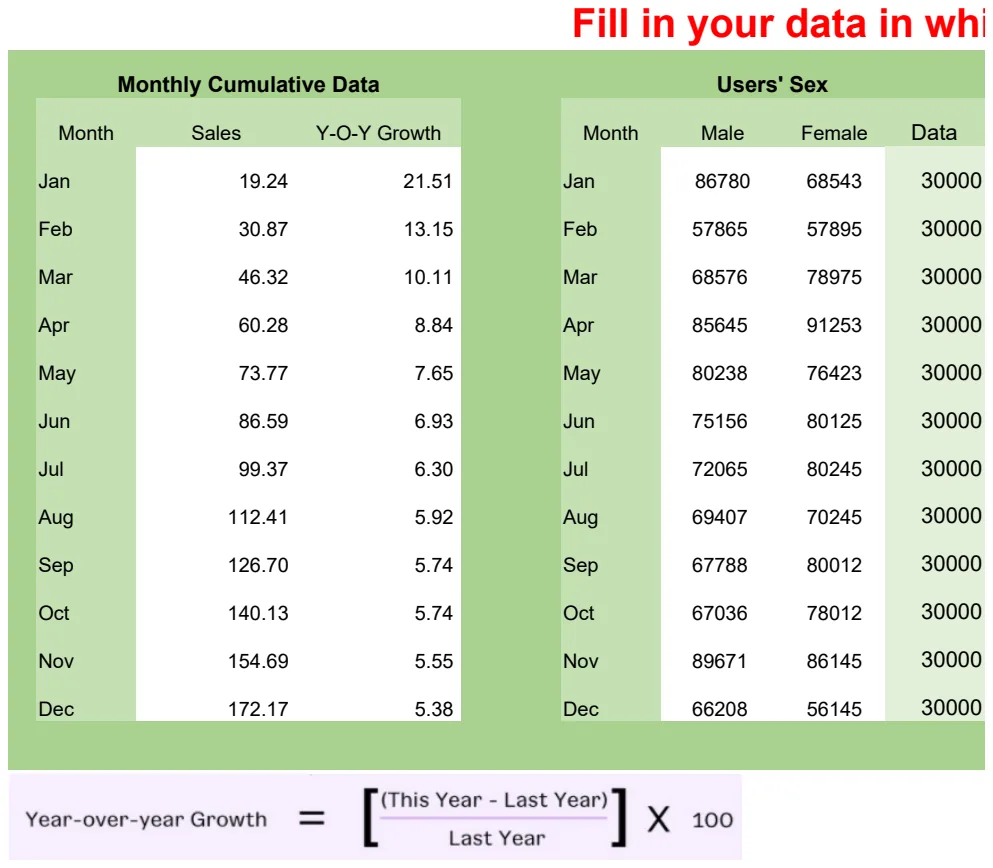
Sales Data Analysis Template
Track monthly sales performance with Y-O-Y growth comparisons and demographic breakdowns.
- Monthly sales entry with white cell input
- Y-O-Y growth calculation
- Demographic breakdown by sex
 Sales & CRM
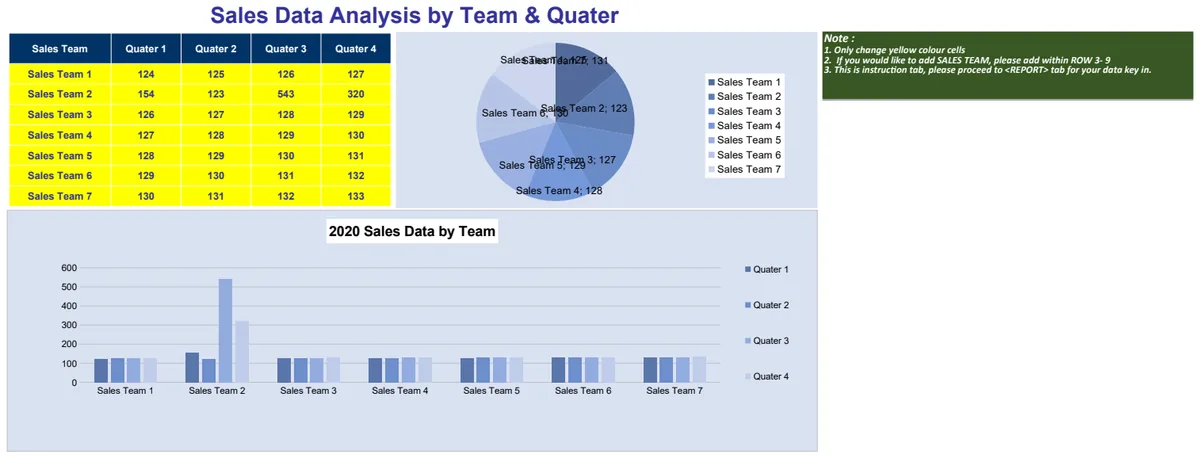
Sales Data by Team
Track and visualize quarterly sales performance across multiple teams with built-in charts.
- Quarterly sales data table by team
- Automatic charts for visual trend analysis
- Team-by-team performance comparison
 Sales & CRM
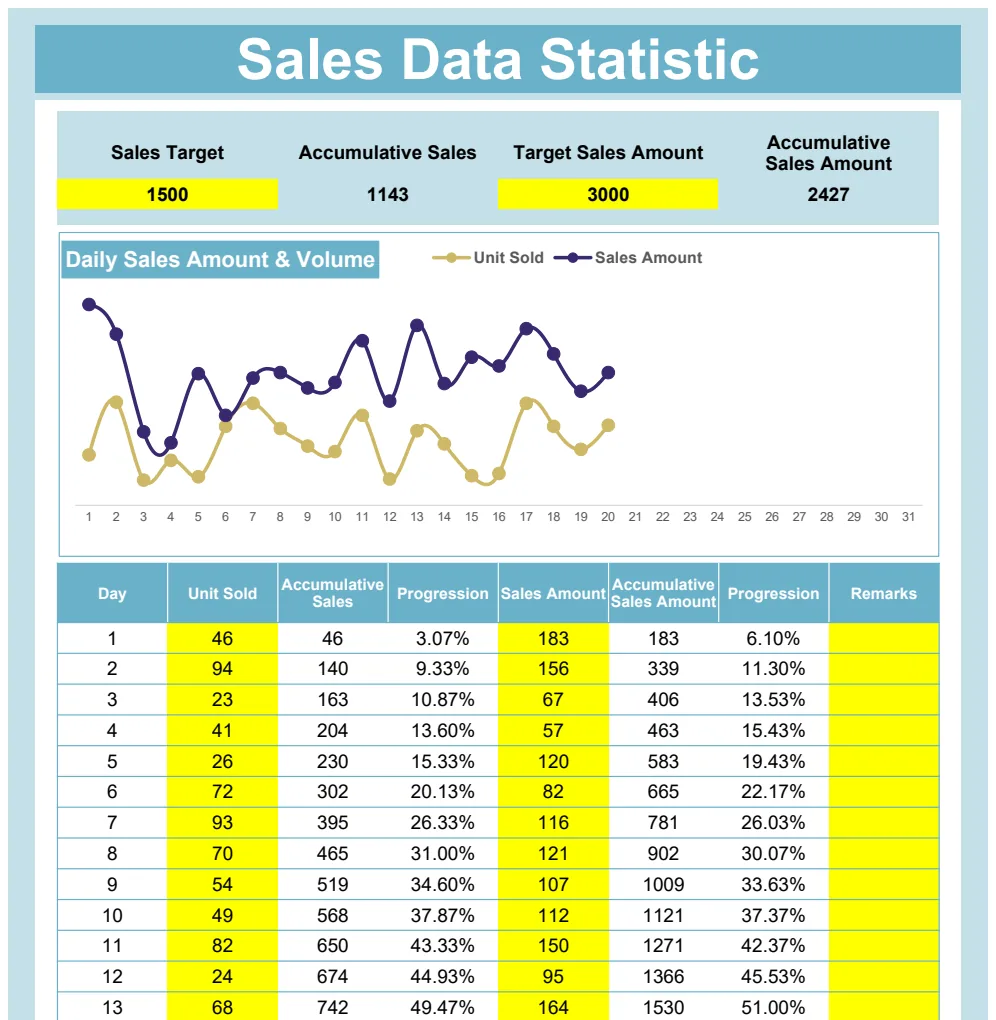
Sales Data Statistic
Track cumulative sales performance against targets with dynamic formulas and visual charts.
- SUM formulas for automatic accumulation
- IF logic for conditional analysis
- Charts visualizing sales vs. targets
 Sales & CRM
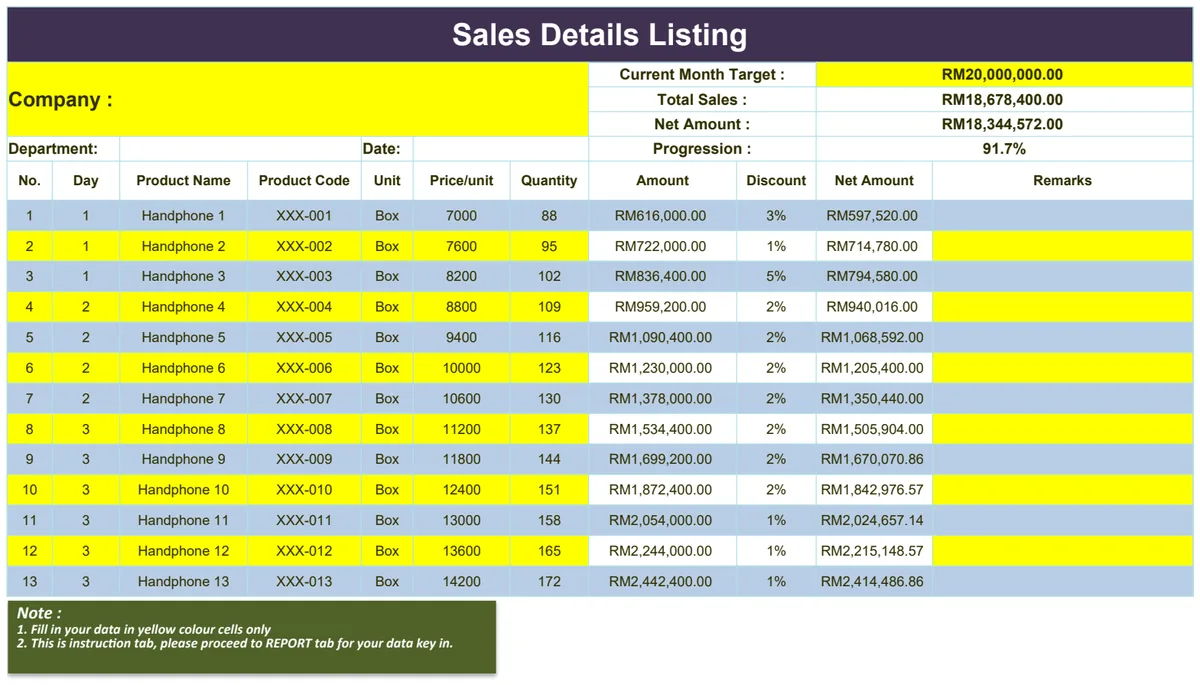
Sales Detail Listing
Track individual sales transactions with company details, amounts, and automatic totals.
- Company-level sales detail rows
- Automatic SUM calculations for total sales
- IFERROR handling for data integrity
 Sales & CRM
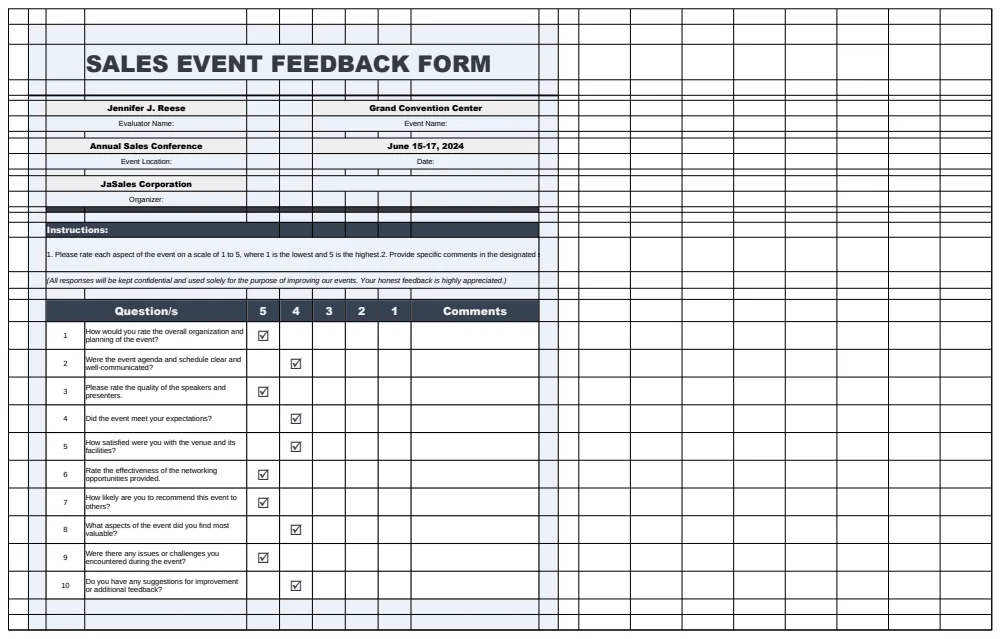
Sales Event Feedback Form Template
Capture and organize feedback from sales events with evaluator details and structured response tracking.
- Evaluator name and contact tracking
- Event location and date capture
- Organizer identification