
Analysis Report Template
A comprehensive analysis report template for tracking and visualizing business metrics like revenue and profit.
This template provides a structured format for creating detailed analysis reports with key metrics such as total revenue and net profit. It includes built-in formulas (IFERROR, SUM) for automatic calculations and charts for visual representation of data. Ideal for business performance reviews, quarterly reporting, and financial analysis presentations.
What's inside
- Revenue tracking
- Profit calculation
- Error handling with IFERROR
- Sum formulas for aggregation
- Data visualization with charts
- Professional report layout
Download this template
.xlsx · 1 sheet · includes charts
$9/monthDownload up to 10 templates a month from a library of thousands. Cancel anytime.
- 10 downloads every month
- Cancel anytime
- 14-day refund policy
More in Data Analysis & Visualization
 Data Analysis & Visualization
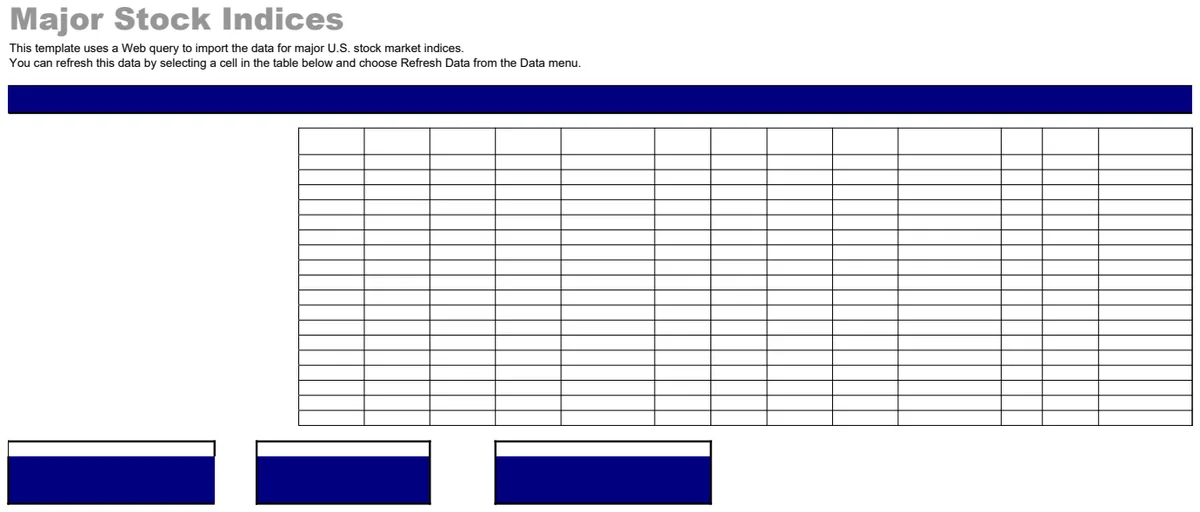
Major Stock Indices
Track major stock market indices with live data refresh using Web queries.
- Web query integration for live data import
- Multiple major indices tracked simultaneously
- One-click refresh to update market data
 Data Analysis & Visualization
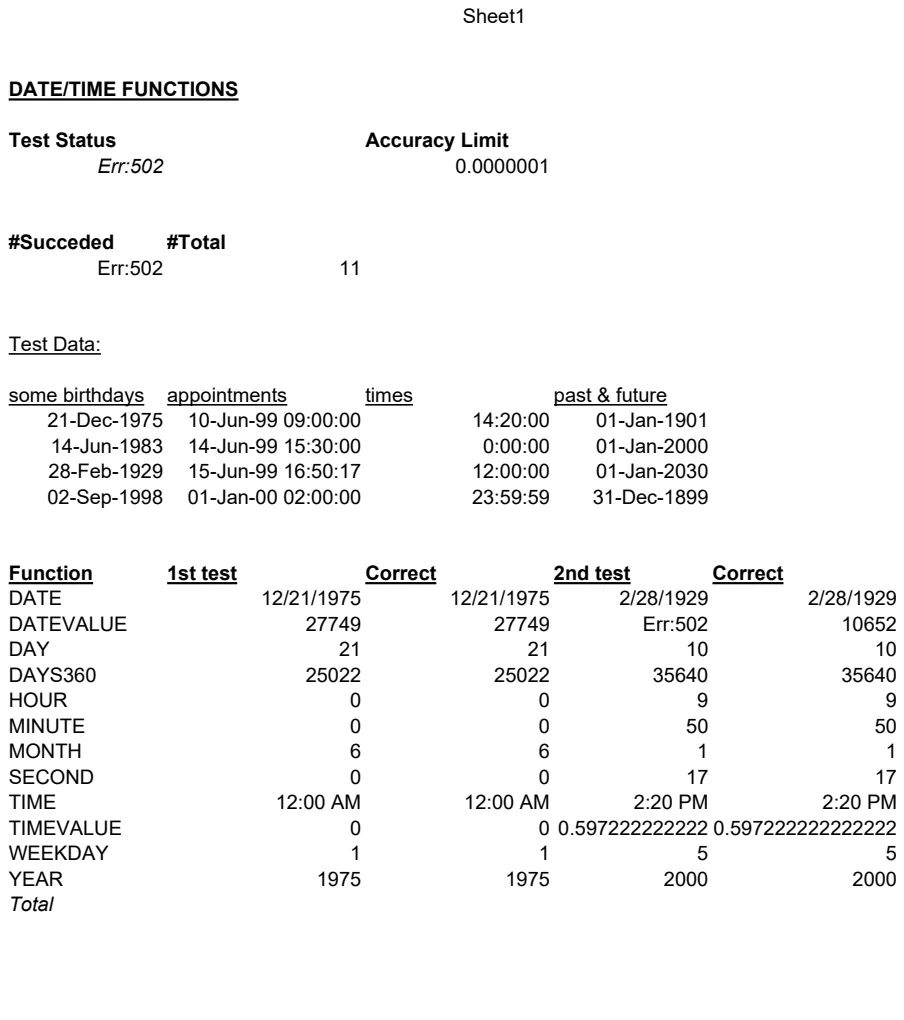
Date/Time Functions Reference Template
Test and reference guide for Excel date/time functions with accuracy validation.
- Pre-built date/time function examples
- Automatic accuracy validation with tolerance testing
- Pass/fail status indicator
 Data Analysis & Visualization
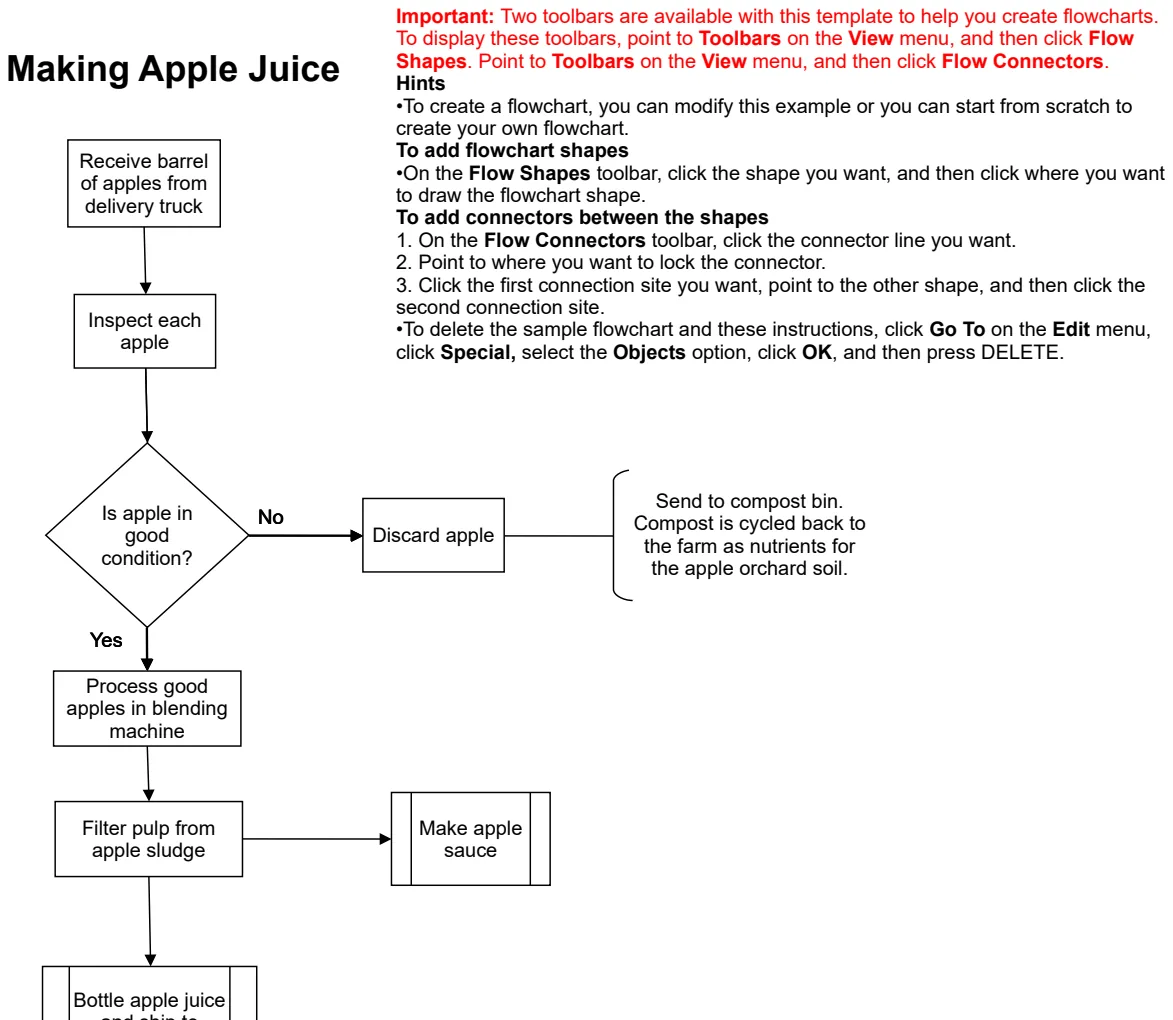
Simple Flowchart
Create visual process flows and decision diagrams to map workflows and business processes.
- Pre-designed flowchart shapes and connectors
- Easy-to-follow step-by-step layout
- Decision point indicators
 Data Analysis & Visualization
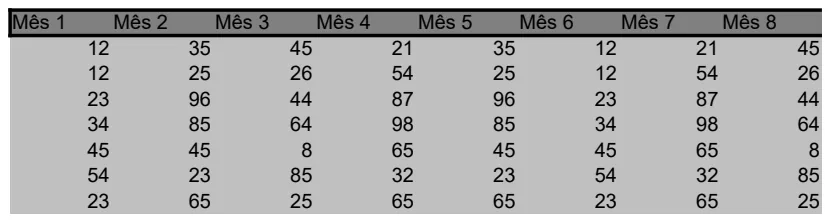
Monthly Performance Tracker
Track 12-month metrics with automatic average calculations for trend analysis.
- 12-month column structure for full-year coverage
- Automatic AVERAGE function for trend calculation
- Row-based data entry for multiple metrics