
Microsoft Excel Gantt Chart Template with Dependencies, Baseline and Resource Workload
A Microsoft Excel Gantt chart project planner: phases and tasks with WBS numbers, finish-to-start, start-to-start, finish-to-finish and start-to-finish dependencies with lag, a baseline with slip, a Gantt chart by day or week, resource workload, a look-ahead list and a project dashboard.
Get this template
.xlsx · 7 sheets · includes charts
This template
$7.95single payment
- Nothing renews
- Download it again whenever you need
- Yours to keep and edit
Monthly plan
$14.95/month
- This template plus 9 more every month
- About $1.50 a template if you use all 10
- Thousands of templates to choose from
- Cancel anytime
- Secure checkout via Creem
- Instant download after payment
- 14-day refund policy
Gantt Chart Project Planner turns a task list into a working project schedule in Microsoft Excel. On the Plan tab, list phases at level 1, tasks at level 2 and subtasks at level 3. Each row gets a WBS number such as 2.2.1, and phase rows take their start, finish and progress from the tasks under them, with progress weighted by duration.
Give each task a duration in workdays, or a finish date, and the ID of the task it follows. Links can be finish-to-start, start-to-start, finish-to-finish or start-to-finish, with a lag or lead in workdays and a second predecessor. A task can follow a single task or a whole phase. Start and finish dates skip weekends and the holidays you list, and you can choose which days are non-working. A start-no-earlier-than date holds a task back when needed, and links that point to a missing task are flagged.
The Gantt Chart tab draws a bar for every task by day or by week. Done work is shaded darker than work to do, late tasks turn coral, phases show as summary bars, milestones as diamonds, the baseline as an amber underline and the status date as a coral line. Change the scale or the first date to move around the plan, and print it as a one-page landscape chart.
Save a baseline by pasting the agreed dates into the baseline columns, and every task and phase shows how many workdays it has slipped. Status compares each task's progress with where the plan says it should be on the status date: Done, In progress, Behind, Late, Not started or Upcoming. The Dashboard shows overall progress against plan, forecast finish against the baseline finish, late and behind counts, the next milestone, phase progress, a milestone list and the tasks that need attention.
The Resources tab lists the people on the project with their availability and shows each person's load week by week, with over-allocation in red, plus a team workload chart against capacity. The Look-ahead tab lists what is in progress, due and starting in the next few weeks for the weekly meeting. Capacity covers 200 rows and 15 resources. Calculated cells are locked and sheet protection has no password. Sample data from a fictional warehouse system rollout is included. Built for Microsoft Excel 2016 or later (desktop or Excel for the web) and contains no macros.
What's inside
- 7 tabs, from a quick-start guide to Settings
- Phases, tasks and subtasks with WBS numbering
- Phase rollup of dates and progress
- FS, SS, FF and SF dependencies with lag or lead
- Second predecessor and links to whole phases
- Workday durations with custom weekends and holidays
- Gantt chart by day or week with progress shading
- Milestones, baseline underline and status date line
- Baseline slip in workdays for tasks and phases
- Status: Done, In progress, Behind, Late, Not started
- Resource workload by week with over-allocation
- Look-ahead list and project dashboard
- Locked formulas, no macros
More in Project Management
 Project Management
Excel Timeline Template: Project Timeline, Milestones & Gantt Chart
An Excel timeline template that draws itself: list tasks, milestones and events, and get a timeline chart with labels placed above and below the axis, colours by category, zoom by week, month, quarter or year, a live Gantt chart and a project dashboard.
- 6 connected tabs, from a quick-start guide to Settings
- Timeline chart that positions milestones and events automatically
- Labels above and below the axis at three heights
 Project Management
Freelance Command Center
An all-in-one Excel workbook for freelancers. Projects, tasks, time, invoices and expenses roll up into a live dashboard with KPIs, deadlines and charts.
- 9 connected tabs, from a quick-start guide to Settings
- Dashboard with 10 KPI cards and 2 charts
- 12-month performance table and next 10 deadlines
 Project Management
Simple Flowchart Template
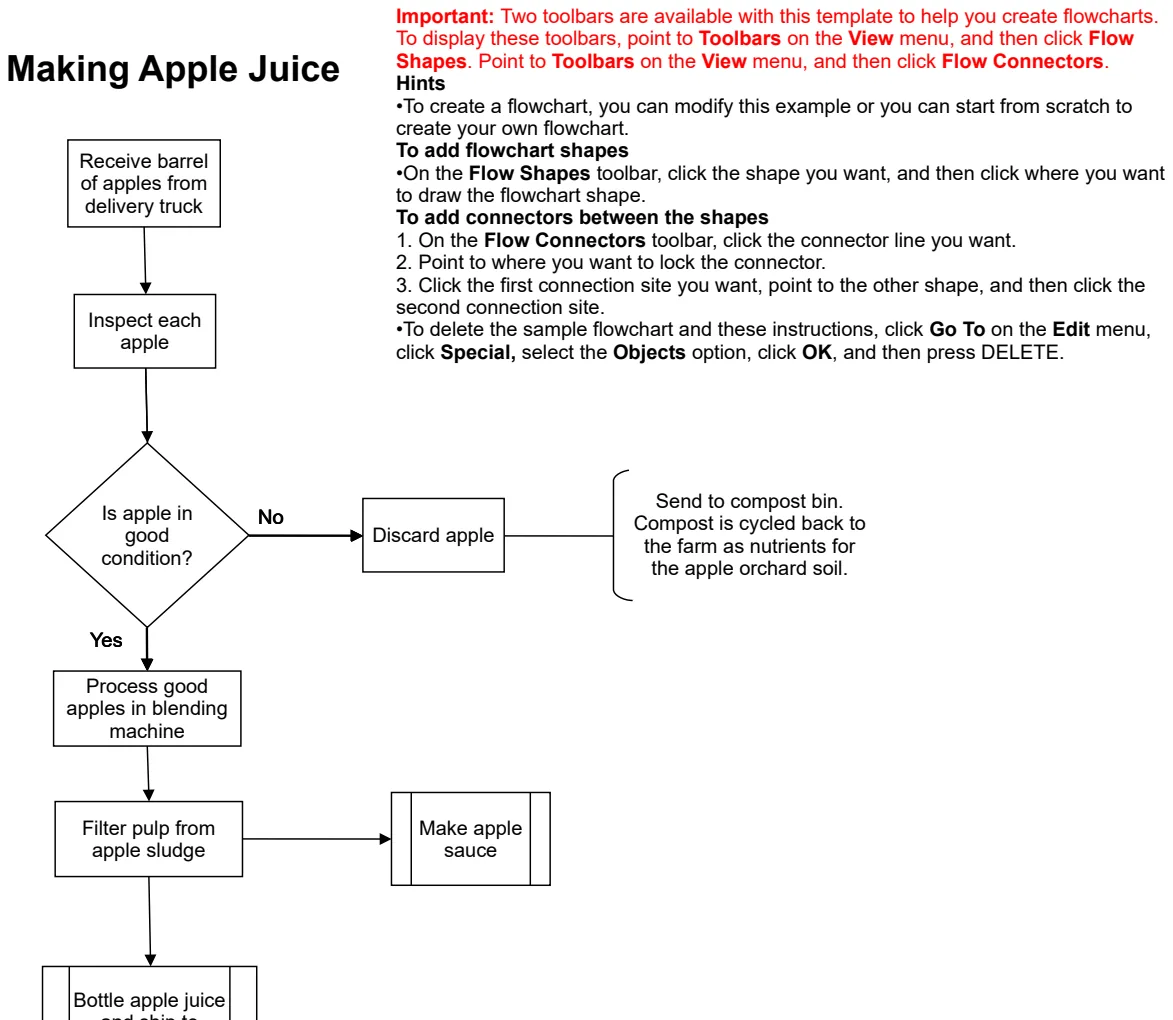
Create process flows and decision diagrams visually in Excel without external design tools.
- Pre-formatted shapes for process steps
- Connector lines for flow direction
- Decision diamond shapes for conditional branches
 Project Management
Agile Gantt Chart
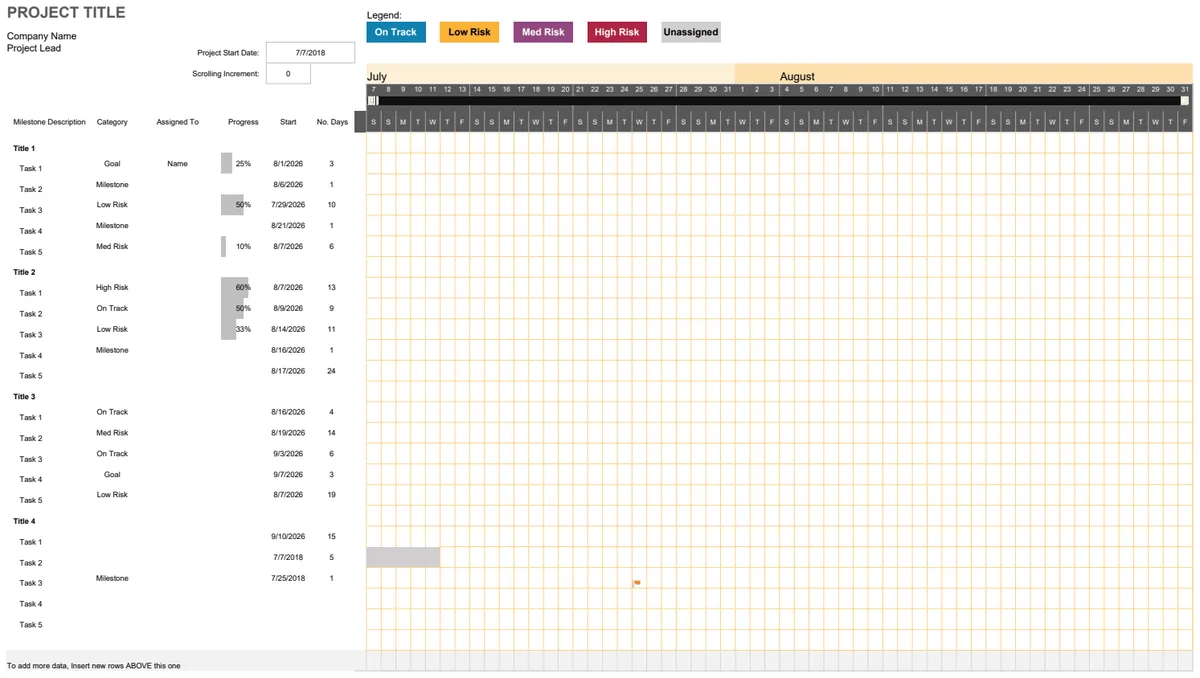
Visual project timeline with milestones, tasks, and team assignments for agile project planning.
- Auto-calculated project duration and dates
- Dynamic legend with milestone color coding
- Project lead and company name fields