10 Best Free Expense Tracker Spreadsheet Templates for 2026
Tracking every dollar you spend sounds simple until you open a blank spreadsheet and stare at empty cells. An expense tracker spreadsheet template gives you the structure, formulas, and categories alr...

Tracking every dollar you spend sounds simple until you open a blank spreadsheet and stare at empty cells. An expense tracker spreadsheet template gives you the structure, formulas, and categories already built so you can start logging transactions today instead of designing layouts tomorrow. These templates work for personal budgets, household shared expenses, freelance business tracking, and small business bookkeeping without requiring paid subscription apps.
Free templates for Google Sheets and Microsoft Excel have evolved significantly by June 2026. Most now include automated category totals using SUMIFS formulas, monthly budget versus actual comparisons, variance tracking, and visual dashboards with charts. Some integrate with bank feeds through services like Tiller, while others rely on manual entry for maximum control. The best part: you own the file, customize every column, and never pay monthly fees.
Starting from a blank spreadsheet can feel overwhelming, which is why templates exist. A good template saves you setup time and ensures you capture the right data from day one. Once you understand how the formulas work, you can adapt any template to match your exact spending habits, income sources, and financial goals.
Essential Features Every Expense Tracker Template Should Include
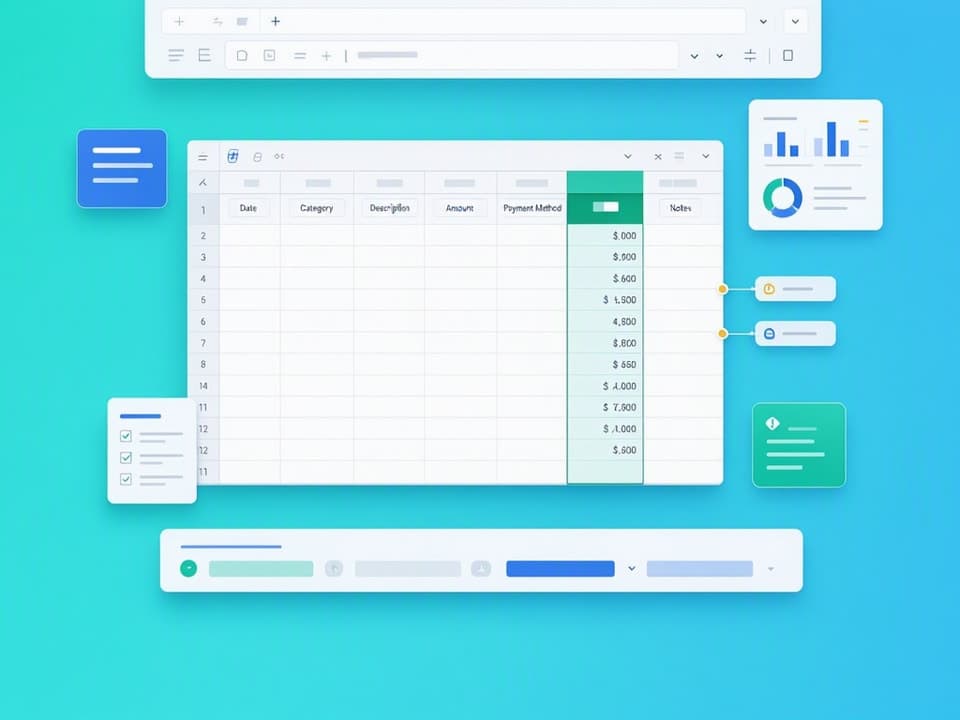
Every useful expense tracker depends on five core columns: date, category, amount, payment method, and notes. The date column lets you filter by month or quarter. The category column groups spending into buckets like groceries, utilities, transportation, and entertainment. The amount column holds the dollar value. Payment method tracks whether you used cash, credit card, debit card, or digital wallet. Notes capture details like store names, invoice numbers, or project codes.
Formulas turn raw data into insight. The SUMIFS function calculates total spending by category, month, or payment method in one line. A simple SUM formula adds up all expenses for quick verification. Monthly budget versus actual sections show whether you stayed under target for each category. Variance columns subtract actual from budget to highlight overspending in red and underspending in green.
Savings rate calculations appear in advanced templates. These divide monthly savings by monthly income to show what percentage you kept. Some templates project full-year spending based on current pace, giving early warning if you're trending over budget. A well-designed template updates all these metrics automatically as you add new rows.
Google Sheets vs. Excel: Which Platform Works Best for Expense Tracking?
Google Sheets wins for collaboration and mobile access. Multiple people can edit the same expense tracker simultaneously, perfect for household budgets or small teams. The mobile app lets you log expenses from your phone while standing in line at the grocery store. Google Sheets also autosaves every change to the cloud, eliminating the risk of lost work.
Excel offers more powerful formulas and faster performance with large datasets. Structured table references make formulas more readable and prevent breakage when you insert rows. Excel's Power Query tool can import and clean bank transaction files in seconds. Desktop Excel handles 50,000 rows without lag, while Google Sheets slows down after 10,000 rows.
As of June 2026, both platforms support the core formulas you need: SUMIFS, SUMIF, IF, and VLOOKUP. Google Sheets has caught up with array formulas through ARRAYFORMULA and QUERY functions. Excel's new dynamic arrays make spill ranges easier. Choose Google Sheets if you share the file or edit from multiple devices. Choose Excel if you process thousands of transactions monthly or need advanced pivot tables.
Manual Entry vs. Automated Import: Choosing Your Data Workflow
Manual entry gives you complete control over category assignment and forces you to review every transaction. You open the spreadsheet, type the date, select a category from a dropdown, enter the amount, and add notes. This workflow takes two minutes per day if you log expenses daily. It builds awareness because you see each purchase as you record it.
Automated import tools like Tiller connect to your bank accounts and credit cards, downloading transactions directly into your spreadsheet. You review the imported rows, assign categories using dropdown menus, and let formulas calculate totals. Automation saves time if you have dozens of transactions weekly. The downside: you still need to categorize each row, and bank feeds sometimes duplicate or miss transactions.
Hybrid approaches combine both methods. Import recurring bills like rent, utilities, and subscriptions automatically. Manually log cash purchases, small expenses, and business receipts that don't appear in bank feeds. This workflow captures everything while reducing daily data entry.
How to Build a Custom Expense Tracker in Google Sheets from Scratch
Open a new Google Sheets file and create column headers in row 1: Date, Category, Description, Amount, Payment Method, Notes. Freeze row 1 by clicking View, then Freeze, then 1 row. This keeps headers visible as you scroll down. Widen the Date column to fit full dates, and set the Amount column to currency format by clicking Format, Number, Currency.
Select the entire Category column by clicking the column letter. Click Data, then Data validation. Choose List from a range, then type your category list in a separate sheet or choose List of items and enter: Groceries, Utilities, Transportation, Entertainment, Healthcare, Dining, Shopping, Housing. Check "Show dropdown list in cell" and click Save. Now every cell in the Category column shows a dropdown menu.
Write your first SUMIFS formula in a summary section below your expense log. In cell G2, type "Total Groceries:" and in cell H2, type: =SUMIFS(D:D,B:B,"Groceries"). This formula sums all values in column D (Amount) where column B (Category) equals "Groceries". Copy this formula down for each category, changing "Groceries" to "Utilities", "Transportation", and so on.
Create a monthly summary by adding a Month column. In column A2, type: =TEXT(A2,"MMM YYYY") to extract the month and year from your date. Then write: =SUMIFS(D:D,A:A,"Jan 2026",B:B,"Groceries") to sum January grocery spending. Replace "Jan 2026" with a cell reference to make it dynamic.
Setting Up Your Category System for Maximum Clarity
Limit your categories to 8 to 12 core buckets. Too many categories create decision fatigue when you log expenses. Too few categories hide useful patterns. Start with: Groceries, Utilities, Transportation, Entertainment, Healthcare, Dining Out, Shopping, Housing, Insurance, Savings, Debt Payments, Miscellaneous. Adjust based on your actual spending.
Consistency matters more than perfection. If you sometimes type "Groceries" and sometimes "Grocery", your SUMIFS formulas will miss half your spending. Use data validation dropdowns to enforce exact spelling. Review your category list monthly and merge duplicates using find-and-replace.
Subcategories work for detailed tracking but complicate formulas. Instead of splitting Transportation into Gas, Insurance, Maintenance, and Parking, use one Transportation category and add details in the Notes column. You can always filter or pivot later if you need subcategory breakdowns.
Writing SUMIFS Formulas to Automatically Calculate Spending by Category
The SUMIFS formula is critical for categorizing and totaling expenses in most spreadsheet trackers. Understanding it means you can fix it, extend it, or troubleshoot it without help. The syntax is: =SUMIFS(sum_range, criteria_range1, criterion1, criteria_range2, criterion2). The sum_range holds the numbers you want to add. Each criteria_range and criterion pair filters which rows to include.
To sum all grocery spending in January 2026, use: =SUMIFS(D:D, B:B, "Groceries", A:A, ">=1/1/2026", A:A, "<=1/31/2026"). This formula sums column D where column B equals "Groceries" and column A falls between January 1 and January 31. Replace the hardcoded dates with cell references to make the formula dynamic.
Every useful expense tracker template depends on this formula. Once you master SUMIFS, you can calculate spending by category, month, payment method, or any combination. Add more criteria pairs to narrow results further. For example, sum credit card grocery purchases in January by adding: E:E, "Credit Card" to the formula.
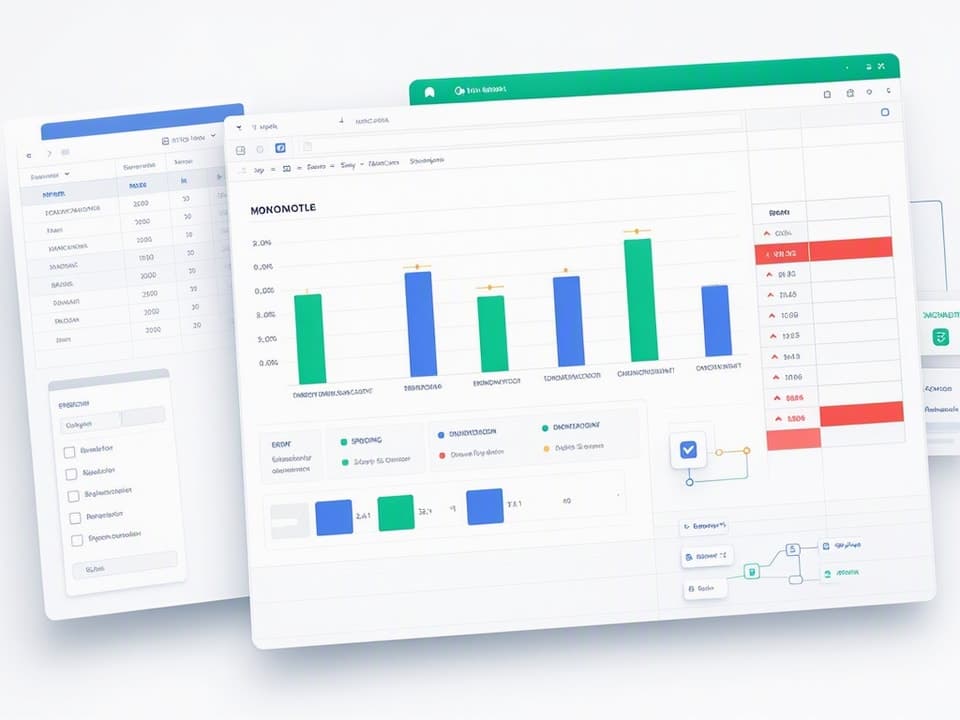
Building a Monthly Summary Dashboard with Charts
Create a summary table in a separate sheet tab. Label column A "Category" and column B "January 2026". List your categories in column A starting in row 2. In cell B2, write: =SUMIFS(Expenses!D:D, Expenses!B:B, A2, Expenses!A:A, ">=1/1/2026", Expenses!A:A, "<=1/31/2026"). This pulls January spending for the category in A2 from your main Expenses sheet.
Copy the formula down for all categories. Add a Total row at the bottom using =SUM(B2:B13). Copy column B to column C and change the date criteria to February. Repeat for each month. Now you have a pivot-style summary showing spending by category across multiple months.
Select your summary table, click Insert, then Chart. Choose a bar chart to compare categories or a pie chart to show spending proportions. Customize colors, labels, and titles. Place the chart above your summary table so it updates automatically as you add expenses. The template does the math and projects out your full-year spending based on where you are in the year. It's one of my favorite parts of the sheet.
Skip the Setup Work
Start with the structure already built
Use a finished template with formulas and dashboards ready to customize
Best Free Expense Tracker Templates for 2026: Google Sheets and Excel Options
Many free expense tracker templates for 2026 are available for both Google Sheets and Microsoft Excel. The Vertex42 Monthly Budget template includes income tracking, budget versus actual comparisons, and a summary dashboard with charts. It works in both Excel and Google Sheets with minimal formula adjustments. The template uses structured tables in Excel for clean formula references.
Tiller's free starter template offers automatic expense import from bank accounts and credit cards. Some advanced templates, like Tiller's, offer automatic expense import, eliminating manual data entry. You still categorize transactions manually, but the download happens daily without logging into multiple bank sites. The template includes monthly and annual summary tabs with spending trends over time.
The Accidentally Retired budget template focuses on variance tracking and savings rate calculations. It highlights categories where you overspent in red and underspent in green. The savings rate section divides monthly savings by income, showing your progress toward financial independence goals. This template works best for personal finance tracking rather than business expenses.
Smartsheet's expense report templates target business use. They include columns for client names, project codes, billable versus non-billable flags, and receipt attachment links. These templates generate expense reports formatted for reimbursement or tax filing. They work in Excel and Google Sheets but require manual entry since Smartsheet doesn't import bank feeds.
When a Pre-Built Template Saves Time vs. Building Your Own
Use a pre-built template when you need to start tracking today without learning formulas. Templates with built-in SUMIFS calculations, category dropdowns, and dashboard charts let you focus on data entry instead of spreadsheet design. Download a template, customize the categories to match your spending, and start logging expenses immediately.
Build your own tracker when you have unique requirements that templates don't address. Freelancers need client and project columns. Households with multiple income sources need per-person tracking. Small businesses need tax category codes and receipt storage links. Starting from scratch gives you complete control over column layout, formula logic, and dashboard design.
Hybrid approaches work well. Download a free template for the formula structure and dashboard layout, then add custom columns for your specific needs. Delete unnecessary sections to keep the file simple. This saves setup time while giving you flexibility.
Troubleshooting Common Expense Tracker Spreadsheet Problems
Totals not adding up usually means category name mismatches. You typed "Grocery" in one row and "Groceries" in another, so your SUMIFS formula only counts one spelling. Common template problems, such as totals not adding up, are often due to category name mismatches. Use data validation dropdowns to prevent typos. Run a pivot table on your Category column to find inconsistent spellings.
Formula errors from deleted rows break cell references. If your SUMIFS formula references D2:D100 and you delete row 50, Excel adjusts the range automatically. But if you delete the entire column, formulas return errors. Use full column references like D:D instead of fixed ranges to prevent breakage.
Date formatting issues cause month filters to fail. If you import bank transactions as text instead of dates, SUMIFS formulas can't compare them. Select the date column, click Format, Number, Date to convert text to proper date values. Check for leading spaces or extra characters that prevent date recognition.
Broken cell references happen when you move summary tables or rename sheet tabs. Formulas that reference Sheet1!A1 break if you rename Sheet1 to Expenses. Update all formula references after renaming sheets. Use named ranges to make formulas more readable and resilient to sheet changes.
Fixing Category Mismatches That Break Your SUMIFS Formulas
Open a pivot table by selecting your expense data, clicking Insert, then Pivot Table. Drag Category to Rows and Amount to Values. Scan the category list for duplicates like "Groceries" and "Grocery". These appear as separate rows even though they mean the same thing.
Use find-and-replace to standardize spellings. Press Ctrl+H (Cmd+H on Mac), type "Grocery" in Find, type "Groceries" in Replace, and click Replace All. Repeat for every duplicate category. This fixes historical data instantly.
Add conditional formatting to highlight potential typos. Select your Category column, click Format, Conditional formatting, and choose "Custom formula is". Enter: =COUNTIF(B:B,B2)=1. Format cells that meet this condition in yellow. Any category that appears only once might be a typo.
Set up data validation dropdowns for future entries. This prevents new typos from breaking your totals. Click Data, Data validation, choose List from a range, and select your master category list. Now users can only pick from approved categories.
Handling Formula Errors When Rows Are Added or Deleted
Use full column references in SUMIFS formulas instead of fixed ranges. Write =SUMIFS(D:D, B:B, "Groceries") instead of =SUMIFS(D2:D100, B2:B100, "Groceries"). Full column references adjust automatically when you insert or delete rows.
Convert your expense log to a structured table in Excel. Select your data, press Ctrl+T, and check "My table has headers". Now formulas use table column names like [@Amount] instead of cell references. Table references never break when you add rows because they expand automatically.
Google Sheets users can wrap formulas in ARRAYFORMULA to handle dynamic ranges. Instead of copying a formula down 100 rows, write one formula in row 2: =ARRAYFORMULA(IF(A2:A<>"", TEXT(A2:A,"MMM YYYY"), "")). This formula fills down automatically as you add data and never breaks from deleted rows.
Avoid merged cells in your expense log. Merged cells cause formulas to skip rows and return incorrect totals. If you need visual grouping, use borders or background colors instead of merging.
Adapting Your Expense Tracker for Different Use Cases
Templates can be adapted for personal, household, freelance, or business expense tracking. Personal trackers focus on budget categories like groceries, utilities, and entertainment. Household trackers add a "Person" column so each family member's spending shows separately. Freelance trackers include client and project columns to track billable expenses. Business trackers add tax category codes, receipt links, and vendor names for bookkeeping.
Personal finance tracking benefits from linking expenses to savings goals and debt payoff plans. Add a savings rate row that divides monthly savings by income. Include a debt payoff tracker on a separate tab showing remaining balances, monthly payments, and payoff dates. Connect net worth tracking by adding asset and liability sections.
Freelance tracking requires separating business from personal expenses. Add a "Type" column with options: Business, Personal, Mixed. Use SUMIFS to calculate total business expenses for tax deductions. Include a "Billable" column to track which expenses you can invoice to clients.
Small business tracking needs vendor names, invoice numbers, and tax categories. Add columns for Vendor, Invoice, Tax Category, and Receipt Link. Use tax categories like Office Supplies, Travel, Meals, and Professional Services to simplify year-end tax filing. Link to cloud storage folders where you save receipt photos.
Personal Finance: Linking Expense Tracking to Savings and Debt Goals
Add a savings rate section below your monthly summary. In one cell, calculate total income using =SUM(Income!B:B) if you track income on a separate sheet. In another cell, calculate total expenses using =SUM(D:D). Subtract expenses from income to get monthly savings. Divide savings by income and format as a percentage to show your savings rate.
Create a debt payoff tracker on a new sheet tab. List each debt in column A: credit cards, student loans, car loans, mortgage. Add columns for Current Balance, Interest Rate, Minimum Payment, and Target Payoff Date. Use the PMT function to calculate required monthly payments: =PMT(rate/12, months, balance). Update balances monthly as you make payments.
Track net worth by adding an Assets and Liabilities section. List bank accounts, retirement accounts, home value, and car value as assets. List all debts as liabilities. Subtract total liabilities from total assets to calculate net worth. Update quarterly to see long-term progress even when monthly expenses fluctuate.
It's very hard to make changes unless you actually know what you're spending money on. Linking expense tracking to bigger financial goals turns daily logging from a chore into a progress dashboard. You see exactly how cutting dining expenses by 100 dollars per month accelerates debt payoff by three months.
Freelance and Small Business: Adding Client, Project, and Tax Columns
Add a Client column between Category and Amount. Use data validation to create a dropdown list of client names. Add a Project column if you track multiple projects per client. This lets you filter expenses by client or project for invoicing and profitability analysis.
Include a Billable column with Yes/No options. Mark business meals, software subscriptions, and contractor payments as billable if you can invoice them to clients. Use SUMIFS to calculate total billable expenses per client: =SUMIFS(Amount, Client, "ClientName", Billable, "Yes"). This shows how much to add to your next invoice.
Add a Tax Category column for year-end filing. Common categories include Office Supplies, Software, Travel, Meals and Entertainment, Professional Services, and Advertising. The IRS provides a complete list of business expense categories. Use SUMIFS to total each tax category annually, then transfer these totals to your Schedule C or tax software.
Store receipt photos in Google Drive or Dropbox. Add a Receipt Link column and paste cloud storage URLs. This keeps receipts organized and accessible during audits without cluttering your spreadsheet with embedded images.
Common Mistakes to Avoid When Using Expense Tracker Templates
Inconsistent data entry breaks formulas and makes reports useless. You type "Gas" one day and "Fuel" the next, creating two separate categories. Use dropdown menus for every column that repeats: Category, Payment Method, Client, Project. This enforces consistency and prevents typos.
Ignoring variance analysis means you never learn from overspending. Your template shows you spent 200 dollars over budget on dining, but you don't adjust next month's behavior. Review variance columns weekly. If a category runs over three months in a row, either increase the budget or cut spending.
Not reviewing monthly turns expense tracking into busywork. You log every transaction but never analyze the data. Set a calendar reminder for the first day of each month. Review total spending, check variance by category, update your budget for the next month, and adjust financial goals based on actual results.
Failing to back up the file risks losing months of data. Google Sheets autosaves to the cloud, but you can still accidentally delete the file. Download a backup copy to your computer monthly. Excel users should save to OneDrive or Google Drive for automatic cloud backup.
Over-complicating categories creates decision fatigue. You split Groceries into Produce, Meat, Dairy, Snacks, and Household Items. Now every grocery trip requires five rows. Simpler categories speed up data entry and still show useful patterns. Add detail in the Notes column when needed.
Ready-Made Templates and Tools to Accelerate Your Expense Tracking
Building consistent logging habits matters more than finding the perfect template. You can download the most advanced expense tracker available, but it won't help if you only update it once a month. Daily logging takes two minutes and prevents the backlog that makes people quit.
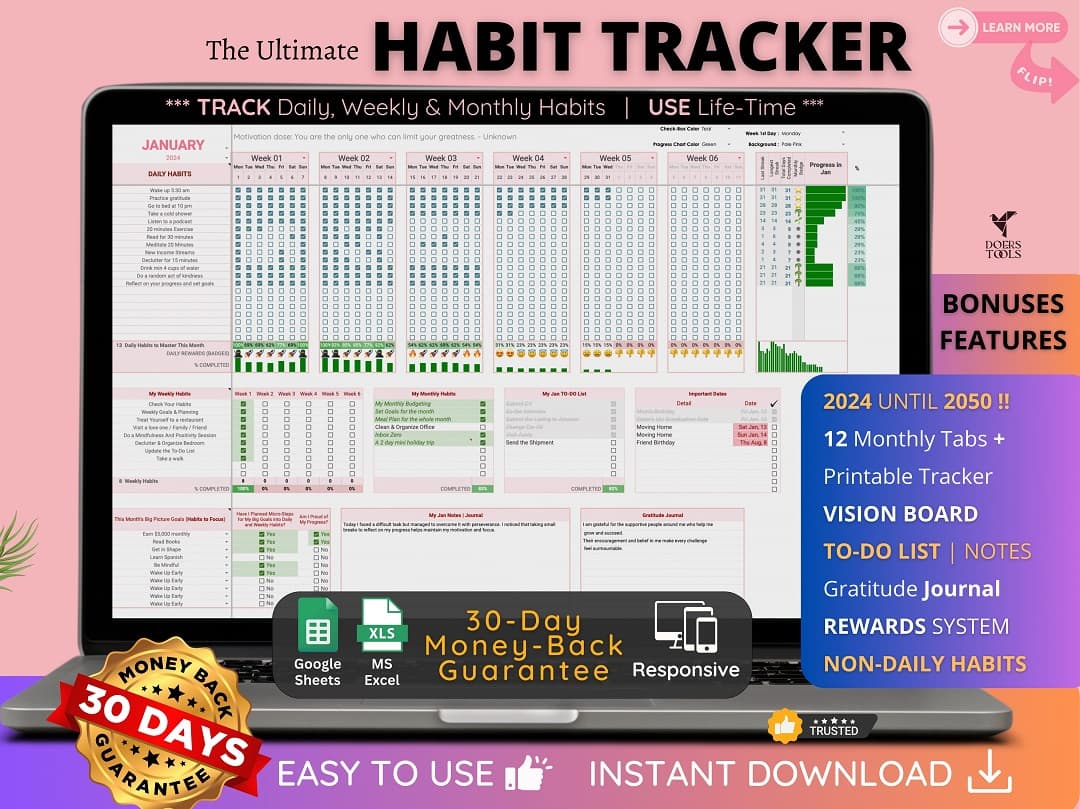
The Ultimate Habit Tracker helps you build the daily expense logging routine that makes any template work. Track your logging streak, set reminders, and see progress over time. The template works in both Google Sheets and Excel, so you can link it to your expense tracker workbook.
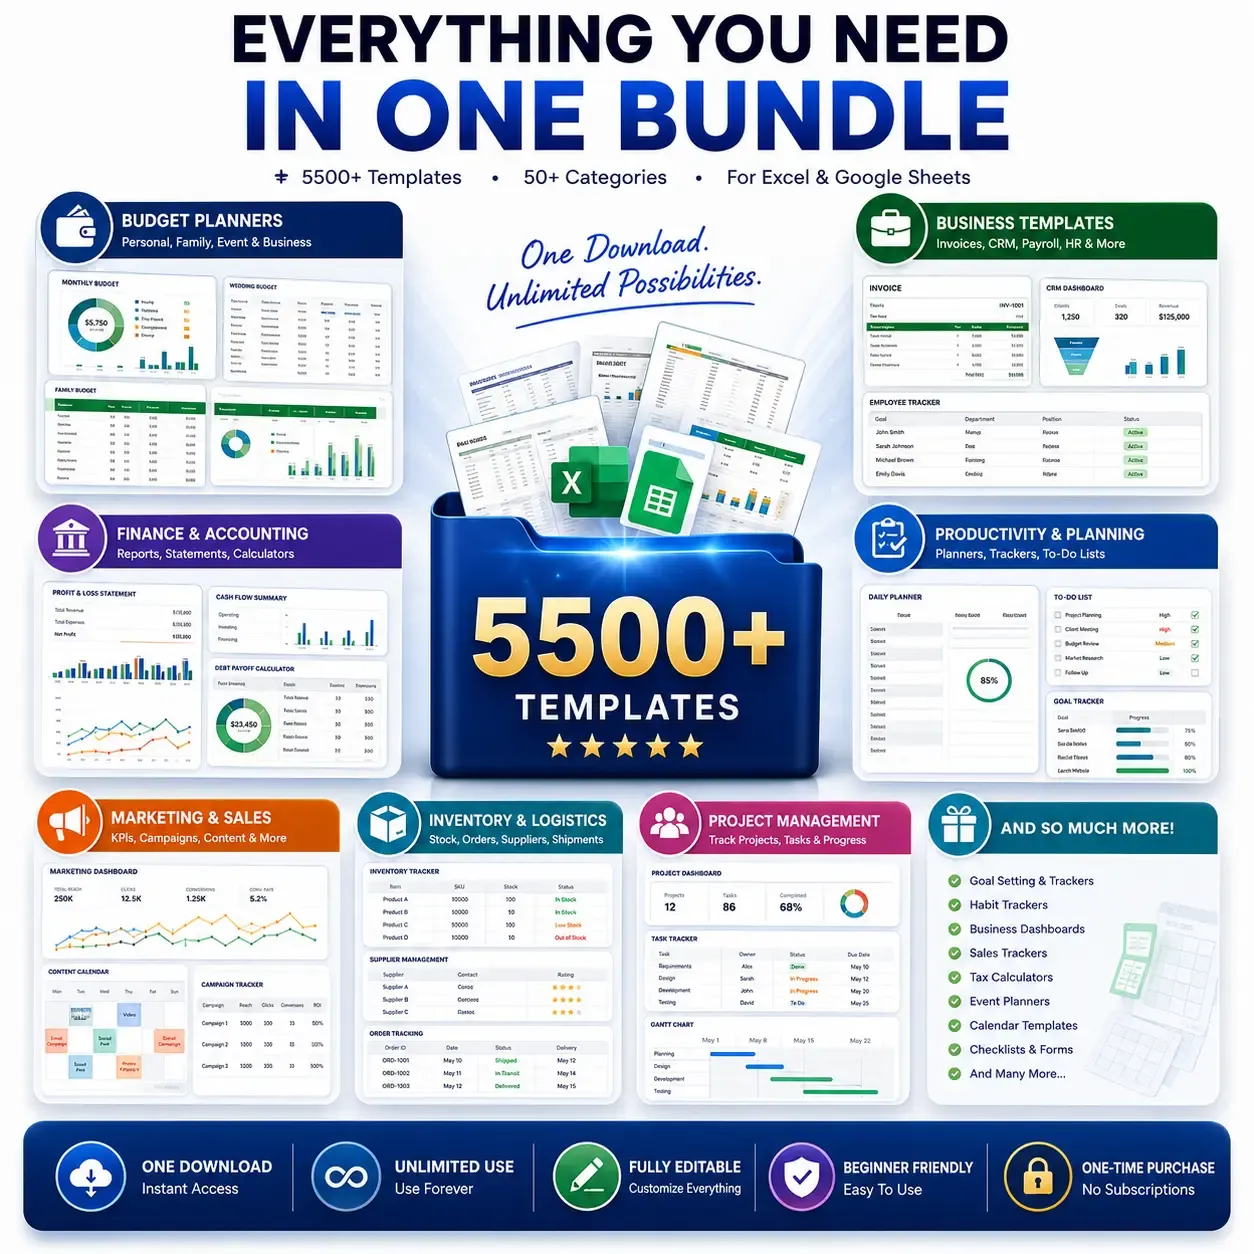
For advanced financial dashboards and business expense tracking, the 5500+ Ms Excel Templates Mega Bundle includes dozens of pre-built expense trackers, budget planners, invoice generators, and cash flow dashboards. These templates feature professional layouts, complex formulas already written, and visual reports that update automatically. The bundle supports Google Sheets, giving you flexibility across platforms.
Choose one template, customize the categories, and start logging today. Review your spending weekly for the first month to catch formula errors and adjust categories. After 30 days of consistent tracking, you'll have enough data to spot patterns, set realistic budgets, and make informed financial decisions. The template is just a tool, but the habit of tracking transforms how you manage money.
Get the newsletter
One sharp idea every Sunday.
No fluff. No sales pitches. Just the best of what we publish, hand-picked.
Continue Reading
Related Articles
10+ Free Cash Flow Forecast Excel Templates for 2026
Cash flow forecasting separates businesses that survive market swings from those that don't. A well-built Excel template gives you weekly visibility into when money arrives, when bills come due, and w...
10+ Free Monthly Budget Spreadsheet Templates for Excel (2026)
A monthly budget spreadsheet template for Excel is a pre-built file that organizes your income and expenses by category, showing exactly where your money goes each month without building formulas and...
10 Free Excel Budget Templates for Small Business (2026)
Small businesses face tighter margins and faster cash burn in 2026 than at any point in the past decade. 74% of small business owners reported increased costs due to inflation, and 83% operate on a ch...