7 essential columns for your restaurant inventory tracker
A structured restaurant inventory spreadsheet template is key to preventing spoilage and boosting profits by tracking stock effectively.
Manually tracking restaurant inventory on paper or in a disorganized spreadsheet is a fast path to spoiled product and lost profits. A structured restaurant inventory spreadsheet template, built with specific categories and formulas, will show you exactly what you have, what you need, and where your money is tied up in stock.
This is more than just a list of items. It’s a dynamic tool that helps prevent over-ordering, identify slow-moving ingredients, and pinpoint potential theft or waste. Getting this right means tighter cost control and a healthier bottom line.
Setting Up Your Core Inventory Sheet
Your primary sheet needs to capture the essentials for every single item you stock. Think of this as your master list. For each row, you'll want columns that clearly identify the product and its current status.
Here are the absolute must-have columns for your core inventory sheet:
- Category: Group items logically (e.g., Produce, Dairy, Meat, Dry Goods, Beverages, Cleaning Supplies, Disposables). This is crucial for later analysis.
- Item Name: Be specific. Instead of "Tomatoes," use "Roma Tomatoes" or "Beefsteak Tomatoes."
- Unit of Measure: How do you buy and count this item? (e.g., Each, Pound, Kilogram, Bunch, Case, Bottle, Gallon). Consistency here is key.
- Beginning Count: The quantity on hand at the start of your inventory period (e.g., start of the week or month).
- Received: Quantity of this item received from suppliers during the inventory period.
- Used/Sold: Quantity of this item consumed in production or sold directly to customers during the period. This is often the hardest to track accurately and might require input from your POS system or prep sheets.
- Ending Count: The quantity on hand at the end of the inventory period. This is usually calculated as:
Beginning Count + Received - Used/Sold. - Physical Count: The actual quantity you count during your physical inventory check. This column is vital for identifying discrepancies.
- Variance: The difference between
Ending CountandPhysical Count. A formula like=G2-H2(assuming Ending Count is in G and Physical Count is in H) will show this. Negative numbers indicate missing stock. - Unit Cost: The cost per unit of measure for this item. This should be updated regularly as supplier prices change.
- Total Inventory Value (Beginning):
Beginning Count * Unit Cost. - Total Inventory Value (Ending):
Ending Count * Unit Cost. - Notes: Any relevant details, like supplier, lot number, or reason for a large variance.
Calculating Usage and Cost
Accurate cost tracking is where a well-designed restaurant inventory spreadsheet template truly shines. You need to know not just what you have, but what it's costing you.
The Unit Cost column is foundational. If you’re using a template that helps manage supplier information, like the Restaurant Purchase Order Form Template, you can often pull these costs directly from your orders.
The Total Inventory Value (Ending) is a simple multiplication, but its real power comes from summing this column across all your items. This gives you your total inventory asset value at any given point.
To understand your usage cost, you'll want to calculate the cost of items actually used or sold during the period. This is often derived from: Used/Sold * Unit Cost. Summing this column will give you your Cost of Goods Sold (COGS) for that period, a critical metric for financial reporting and tax purposes.
Tracking Inventory Variance
The difference between your calculated Ending Count and your Physical Count is your variance. This is a critical indicator of problems. A significant negative variance might suggest:
- Theft: Items are being taken without being recorded.
- Waste: Product is spoiling, being dropped, or improperly discarded.
- Errors: Mistakes in receiving, issuing, or recording usage.
- Inaccurate Unit Costs: If your unit cost is wrong, your calculated ending count might seem off even if the physical count is correct.
Investigate any variances that exceed a predetermined threshold, perhaps 5% of the item's value or more than a specific quantity. This investigation is key to maintaining tight control.
Implementing Physical Counts
Physical inventory counts are non-negotiable. How often you do them depends on your operation, but here's a common approach:
- 01Frequency: Conduct full physical inventories at least monthly. High-value or fast-moving items like fresh produce, meats, and alcohol might benefit from weekly counts.
- 02Preparation:
- Stop receiving/issuing: Ideally, conduct counts when the kitchen is closed or during a slow period to avoid last-minute transactions skewing your numbers.
- Organize: Ensure all stock is neatly organized, consolidated, and clearly labeled. Items in the back of coolers or refrigerators need to be brought forward and counted.
- Use count sheets: Print count sheets or use a dedicated section of your spreadsheet on tablets. Assign teams to specific sections.
- 03Counting:
- Two-person teams: One person counts, the other records. This minimizes errors.
- First-in, first-out (FIFO): When counting items like beverages or dry goods, count what's in the front first, then what's behind it.
- Weighing/Measuring: For items sold by weight or volume (flour, sugar, oil), use scales and measuring cups for accuracy.
- 04Data Entry: Input all physical counts into your spreadsheet immediately after counting.
- 05Reconciliation: Compare your physical counts to your system's
Ending Count. Calculate theVariancecolumn.
Advanced Features and Analysis
Once your core inventory tracking is solid, you can add layers of sophistication.
- Par Levels: Set a minimum stock level for key items. When your
Ending Countdrops below this par level, it flags that you need to reorder. - Reorder Points: This is similar to par levels but considers lead time. It’s the stock level at which you must place an order to avoid running out before the next delivery.
- Food Cost Percentage: Calculate this for specific dishes or menu items. It’s
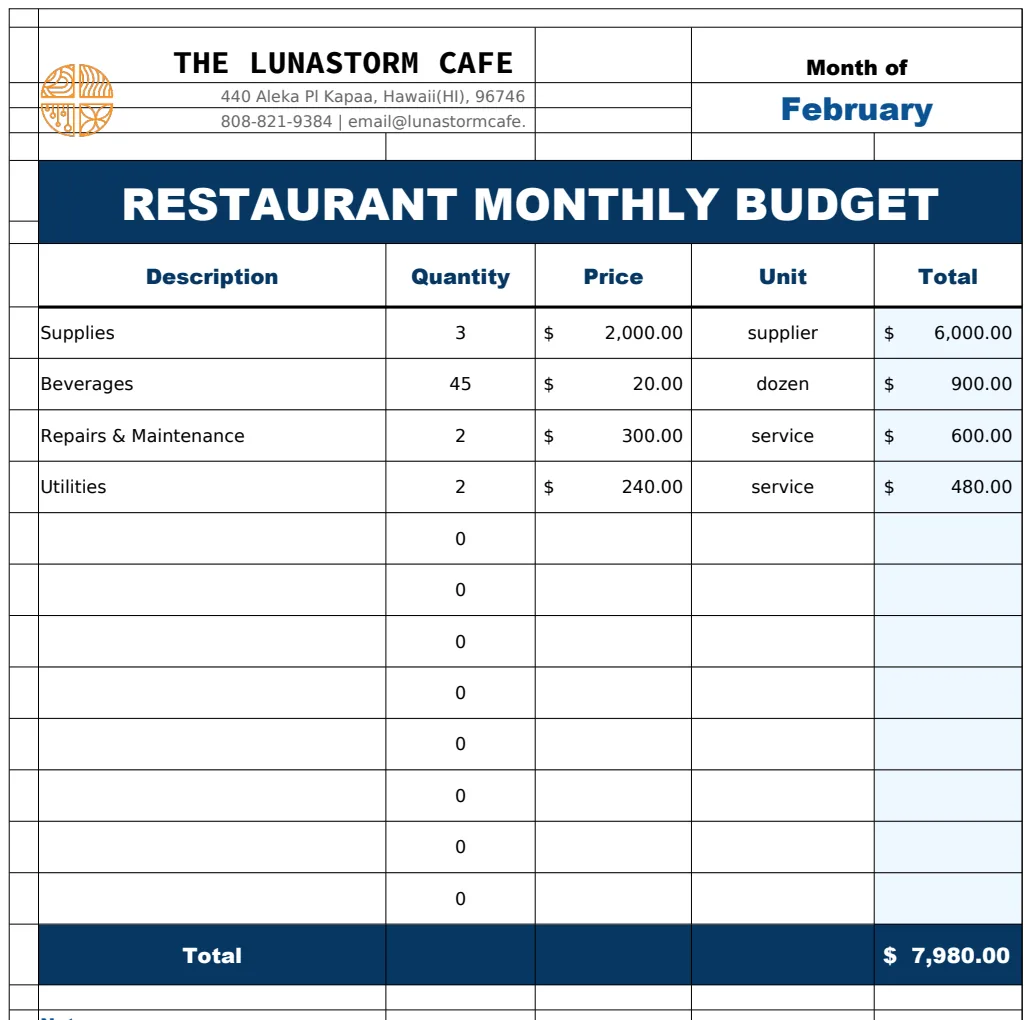
(Cost of Ingredients for Dish / Selling Price of Dish) * 100. A robust Restaurant Monthly Budget Template can help you track these costs against revenue. - Inventory Turnover: This metric shows how many times your inventory has been sold and replaced over a period. A high turnover is generally good, indicating efficient sales and minimal holding costs. The Inventory Turnover Analysis Template is designed for this.
Common Mistakes to Avoid
- Inconsistent Units of Measure: Receiving in cases but counting in individual items, or vice-versa, without clear conversion. Always define and stick to one primary unit for counting and costing.
- Ignoring Small Items: Skipping counts for salt, pepper, spices, or minor disposables adds up. These small items can represent significant losses if not tracked.
- Not Updating Unit Costs: Supplier prices fluctuate. If your
Unit Costis stale, your inventory valuation and COGS will be inaccurate. Schedule regular cost updates. - Failing to Investigate Variances: Large variances are red flags. Ignoring them allows problems like theft or waste to persist and grow.
- Over-reliance on Memory: Never try to "eyeball" inventory levels. The human mind is prone to error, especially under pressure. Document everything.
Frequently Asked Questions
How often should I update my inventory spreadsheet?
You should update your spreadsheet daily with received goods and sales/usage data if possible. Physical counts should occur at least monthly, with high-value items potentially being counted weekly. The critical part is reconciling your physical count with your spreadsheet data after each physical count.
Can I use this template for alcohol inventory?
Absolutely. Alcohol is a high-value item where precise tracking is crucial. You’ll want to be very specific with your Item Name (e.g., "Tito's Vodka 1L," "Cabernet Sauvignon Bottle") and your Unit of Measure (e.g., "Bottle," "Ounce" for pours). You might even consider a separate sheet or category for liquor, wine, and beer due to their distinct cost structures and variance potential.
What if my POS system tracks some inventory?
That's a great starting point. Many modern POS systems can track ingredient usage based on menu item sales. However, these systems rarely account for waste, spoilage, or theft. Your spreadsheet should integrate this POS data but also include columns for your physical counts and variances to catch what the POS misses.
How do I calculate the cost of ingredients used if my POS doesn't track it?
This is a common challenge. You'll need to rely on your prep sheets and kitchen logs. For example, if your prep team uses 5 pounds of onions daily, and your Unit Cost for onions is $0.80/lb, then your daily onion usage cost is $4.00. Summing these daily usage costs across all ingredients will give you your total ingredient cost for the period. This method requires diligent record-keeping by your kitchen staff.