Automated Cash Flow Forecast: 2026 Google Sheets Guide
Building an automated cash flow forecast in Google Sheets for 2026 gives you a clear financial roadmap. You can proactively identify potential shortfalls or surpluses, allowing for better strategic de...
Building an automated cash flow forecast in Google Sheets for 2026 gives you a clear financial roadmap. You can proactively identify potential shortfalls or surpluses, allowing for better strategic decisions. Starting with a structured sheet and the right formulas transforms raw data into actionable insights, without needing expensive software.
Setting Up Your 2026 Automated Cash Flow Forecast in Google Sheets (User's First Steps)
Your cash flow forecast begins with a well-organized Google Sheet. This initial setup dictates how easily you'll track and update your financial projections throughout the year. A clear structure prevents errors and simplifies data entry.
Structuring Your Google Sheet for Optimal Forecasting
Dedicate separate tabs for different data types to maintain clarity. Create tabs like "Dashboard," "Inflows," "Outflows," "Actuals," and "Assumptions." This separation keeps your model clean and formulas manageable.
On your "Inflows" and "Outflows" tabs, set up columns for "Date," "Description," "Category," and "Amount." For "Assumptions," list key variables like payment terms, growth rates, and recurring expenses. The "Dashboard" tab will summarize your findings.
Core Formulas for Calculating Projected Cash Flow
The fundamental calculation for cash flow is straightforward: Projected Cash Flow = Estimated Cash Inflows − Estimated Cash Outflows. You will apply this principle across your forecast periods. Use SUMIF or SUMIFS to aggregate cash movements by category or month.
For example, on your "Dashboard" tab, a formula like =SUMIF(Inflows!$C:$C,A2,Inflows!$D:$D) could sum all inflows for a specific month listed in cell A2. Repeat this for outflows, then subtract to get your net cash flow. This provides a clear, period-by-period financial outlook.
Gathering and Organizing Your Financial Data for 2026
Accurate forecasts depend on accurate data. Collect historical bank statements, sales records, and expense reports from 2026. Use these past figures as a baseline for your 2026 projections, adjusting for known changes or growth.
Organize this data into your "Inflows" and "Outflows" tabs. The more complete and organized your records, the more accurate your forecast will be. This foundational data is crucial for reliable predictions.
Automating Projections with Google Sheets Functions (Leveraging Built-in Tools)
Google Sheets offers powerful functions to automate your projections, reducing manual effort and improving consistency. These tools help you move beyond simple sums to more dynamic forecasting.
Using the FORECAST Function for Future Inflows and Outflows
The FORECAST function predicts future values based on existing historical data. If you’re ready to rely on predictions provided by Google Sheets, then you can go with the FORECAST function. This will calculate the expected value for your costs or income based on a linear regression of a dataset.
For instance, =FORECAST(C2, B2:B10, A2:A10) predicts the cash inflow for the date in C2, based on historical inflows in B2:B10 and corresponding dates in A2:A10. Apply this to both inflow and outflow categories where historical trends are relevant. This function provides a data-driven estimate for future cash movements.
Incorporating Scenario Planning with IF and SWITCH Functions
Build flexibility into your forecast with scenario planning using IF and SWITCH functions. This allows you to model different business outcomes, such as optimistic, pessimistic, or realistic scenarios. Create a cell for "Scenario Selection" on your "Assumptions" tab.
Then, use formulas like =IF(Assumptions!$B$1="Optimistic", B2*1.1, B2) to adjust projected values. The SWITCH function can handle multiple scenarios more cleanly: =SWITCH(Assumptions!$B$1, "Optimistic", B2*1.1, "Pessimistic", B2*0.9, B2). This lets you instantly see the impact of different assumptions on your cash flow.
Building a 13-Week Rolling Cash Flow View
A 13-week cash flow forecast is a common short-term planning tool, updated weekly. Create a dedicated section on your "Dashboard" tab for this. Set up columns for each of the next 13 weeks.
Use formulas to pull relevant inflow and outflow data for each week, summarizing your net cash position. This rolling view gives you immediate insight into short-term liquidity, crucial for operational decisions.
Recommended Resources
Skip the blank-sheet setup
Get a head start with pre-built templates that save hours of setup and formula creation.
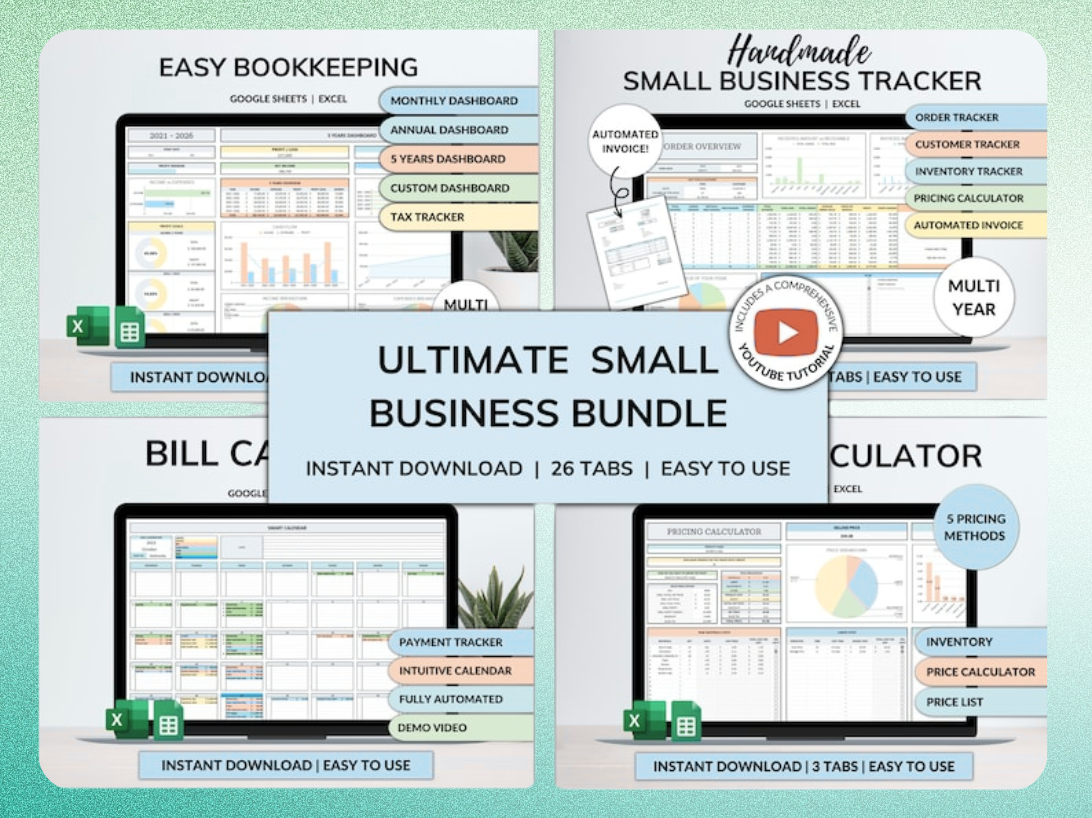
Ultimate Small Business Bundle Templates - Google Sheet + Ms Excel
All-in-One Spreadsheets for Bookkeeping, Inventory, Orders, Billing & Pricing Save Hours Every Week: Automate data entry and dashboards so you can focus on growth, not spreadsheets.
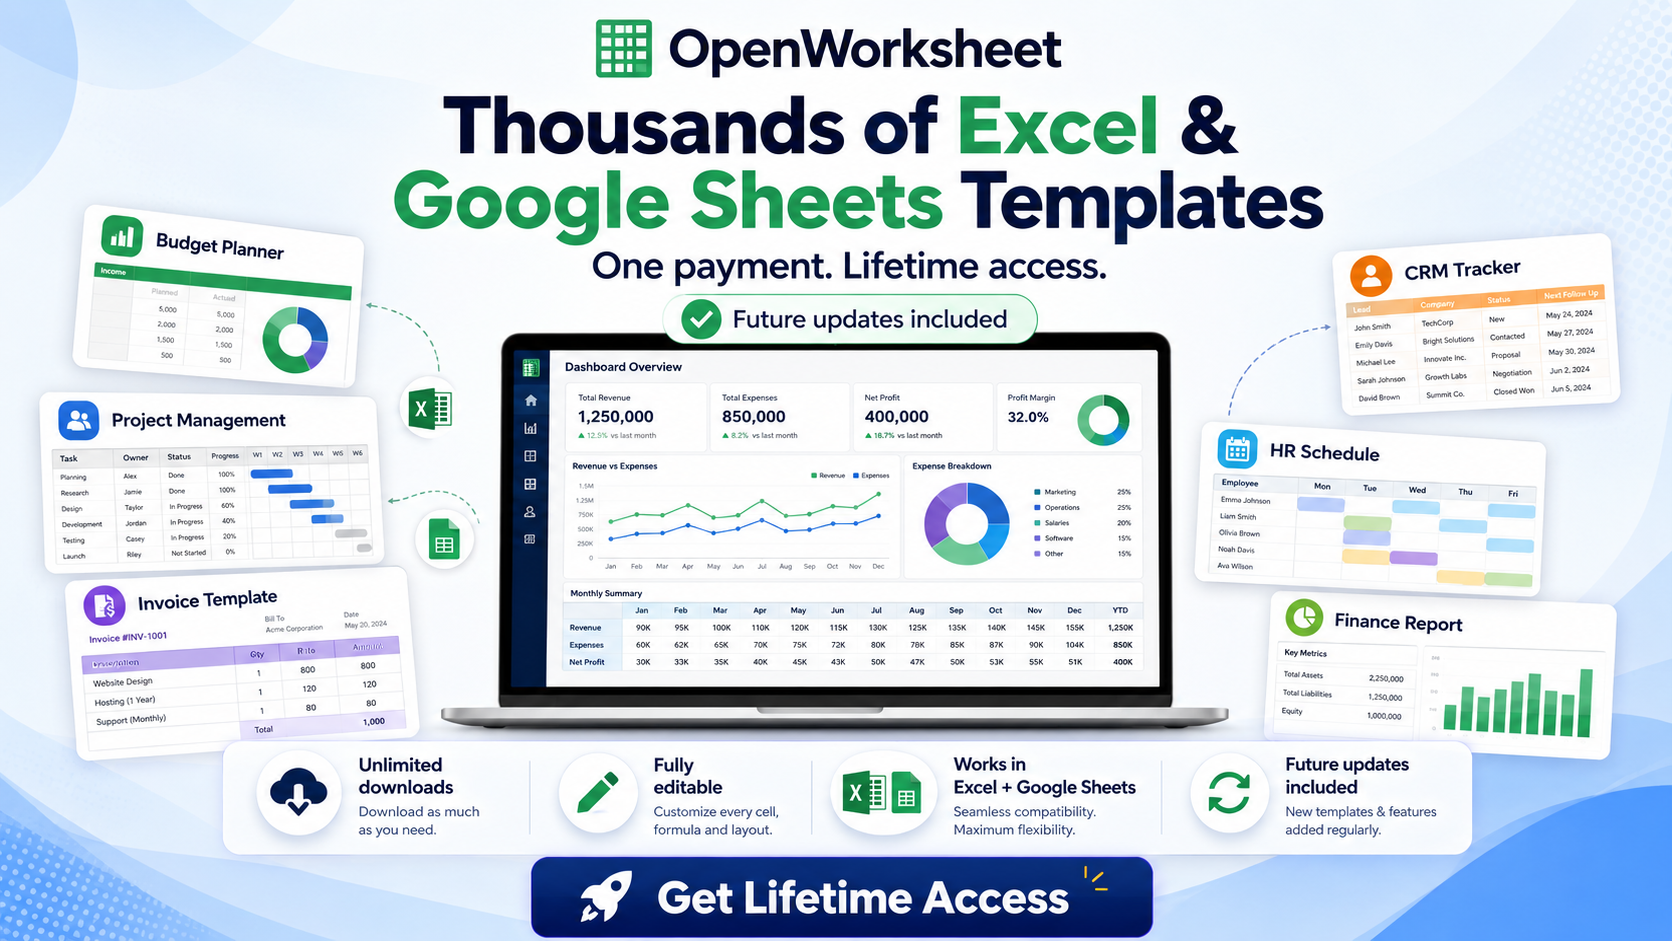
Thousands of Spreadsheet Templates Mega Library – Google Sheet Supported
Integrating Actuals and Refining Your Forecast (Continuous Improvement)
Your forecast is a living document, not a static report. Regularly comparing projections to actual performance helps you refine your model and improve accuracy over time. This feedback loop is essential for effective financial management.
Tracking Actual Cash Inflows and Outflows
Create an "Actuals" tab with the same column structure as your "Inflows" and "Outflows" tabs. As transactions occur, record them here. This centralizes your real-world financial data for easy comparison.
Regularly update this tab, perhaps weekly, to keep your actuals current. Accurate tracking forms the basis for meaningful variance analysis. Without current actuals, your forecast adjustments will be less effective.
Performing Variance Analysis to Understand Discrepancies
Variance analysis highlights the differences between your forecasted and actual cash flows. On your "Dashboard" or a dedicated "Variance" tab, calculate the difference for each line item and period. A simple formula like =Actuals!B2 - Forecast!B2 will show the variance.
Analyze significant variances to understand their root causes. Did sales exceed expectations? Were expenses higher than planned? This analysis provides critical insights into your business operations and the accuracy of your assumptions.
Adjusting Your 2026 Forecast Based on Performance
Use your variance analysis to adjust future forecast periods. If a particular expense consistently runs higher than projected, update your "Assumptions" tab and future outflow projections. This iterative process continually improves your model's predictive power.
The goal is to make your forecast a more reliable reflection of your business's financial reality. Consistent adjustments ensure your 2026 cash flow model remains a valuable tool.
Best Practices for Maintaining an Accurate Cash Flow Model (Ongoing Management)
Maintaining an accurate cash flow model requires discipline and consistency. Adopting best practices ensures your forecast remains reliable and useful for decision-making throughout 2026.
Establishing a Regular Review and Update Schedule
Set a recurring schedule for reviewing and updating your cash flow forecast. Many businesses update their 13-week rolling forecast weekly and their monthly forecast at least once a month. Consistent updates capture new information and keep your projections fresh.
Mark these review times on your calendar and stick to them. Regular maintenance prevents the forecast from becoming stale and irrelevant.
Visualizing Your Cash Flow Trends with Google Sheets Charts
Visualizing your cash flow data makes trends immediately apparent. Use Google Sheets' charting tools to create line graphs for net cash flow over time, or bar charts comparing actuals to forecasts. Go to Insert > Chart and select your data range.
These charts quickly highlight periods of high liquidity or potential shortfalls. Visualizations communicate complex financial information more effectively than raw numbers alone.
Troubleshooting Common Forecasting Errors
Common forecasting errors include outdated assumptions, incorrect data entry, or formula mistakes. Double-check your SUMIF or FORECAST ranges for accuracy. Verify that your actuals are correctly matching up with your forecast periods.
If discrepancies arise, trace back through your formulas and data sources. Many finance teams start cash forecasting in spreadsheets, and while Google Sheets is flexible, familiar, and easy to customize, it requires constant manual updates, version control management, and formula maintenance to keep forecasts accurate and current.
When to Use a Template vs. Building from Scratch (Efficiency and Speed)
Deciding whether to build a cash flow forecast from scratch or use a template depends on your time, expertise, and specific needs. Both approaches have their merits.
Benefits of Starting with a Pre-Built Cash Flow Template
Starting with a pre-built template saves significant time and effort. Templates already include the necessary structure, common formulas, and often a dashboard, so you don't have to build them from a blank sheet. This reduces setup time and minimizes formula errors.
For instance, the Thousands of Spreadsheet Templates Mega Library offers a variety of pre-designed cash flow models. They provide a proven framework, allowing you to focus immediately on inputting your data rather than designing the sheet.
Customizing a Template for Your Specific Business Needs
Even with a template, customization is often necessary. Adjust column headers to match your specific terminology, add unique expense categories, or integrate business-specific revenue streams. Templates provide a strong foundation, but you tailor them to fit your exact operational requirements.
Ensure the template's formulas correctly reference your customized sections. A good template allows for easy modification without breaking its core functionality.
Beyond Google Sheets: Exploring Advanced Automation (Scaling Your Operations)
While Google Sheets is powerful, businesses with complex financial structures or high transaction volumes might eventually benefit from more specialized tools. Understanding these alternatives helps you scale your operations effectively.
Comparing Spreadsheet Forecasting to Dedicated Financial Software
Spreadsheets offer flexibility and low cost, making them ideal for many small to medium-sized businesses. However, dedicated financial software often provides robust reporting, integration with banking and accounting systems, and advanced automation features. These platforms can reduce reconciliation time and improve forecast accuracy.
The choice depends on your business size, budget, and the complexity of your financial operations. For many, Google Sheets remains the go-to for its familiarity and adaptability.
Automating Data Entry and Reporting with Integrated Solutions
For businesses ready to move past manual data entry, integrated solutions automate the flow of financial information. These platforms connect directly to your bank accounts, payment processors, and accounting software. This reduces manual errors and ensures your forecast data is always current.
Products like the Ultimate Small Business Bundle Templates can bridge this gap for smaller operations, offering comprehensive spreadsheets for bookkeeping, inventory, and billing. They automate dashboards and data entry, freeing you to focus on growth.
Get the newsletter
One sharp idea every Sunday.
No fluff. No sales pitches. Just the best of what we publish, hand-picked.
Continue Reading
Related Articles
15+ Free P&L Templates for Excel & Google Sheets (2026)
A Profit and Loss P&L statement isn't just a financial report. It's a real-time health check for your business, offering critical insights into your revenue, costs, and ultimately, your profitability....
10+ Free Excel Budget Templates for Small Business in 2026
Your small business needs a budget. It's more than a financial report; it's a strategic roadmap, especially in 2026's dynamic market. A clear budget helps you allocate resources, anticipate challenges...
10 Best Expense Tracker Spreadsheet Templates for 2026
An effective expense tracker spreadsheet is more than just a budgeting tool; it's a financial compass. In 2026, navigating personal finances or running a small business without clear visibility into y...