Build a sales tracker in under an hour
Create your own sales tracker spreadsheet template free in under an hour to manage deals and pipeline performance.
By the end of this, you'll have a functioning sales tracker in a spreadsheet, ready to log new deals, update statuses, and see which leads are moving through your pipeline. You’ll know precisely where your revenue is coming from and how your sales process is performing. Finding a good sales tracker spreadsheet template free can feel like a treasure hunt, but setting one up yourself or adapting an existing one is more straightforward than you might think.
This guide will walk you through the essential components of a sales tracker, offer a practical setup, and highlight common pitfalls to avoid. Whether you're a solopreneur or manage a small team, a well-organized tracker is crucial for understanding your sales landscape.
Core Components of a Sales Tracker
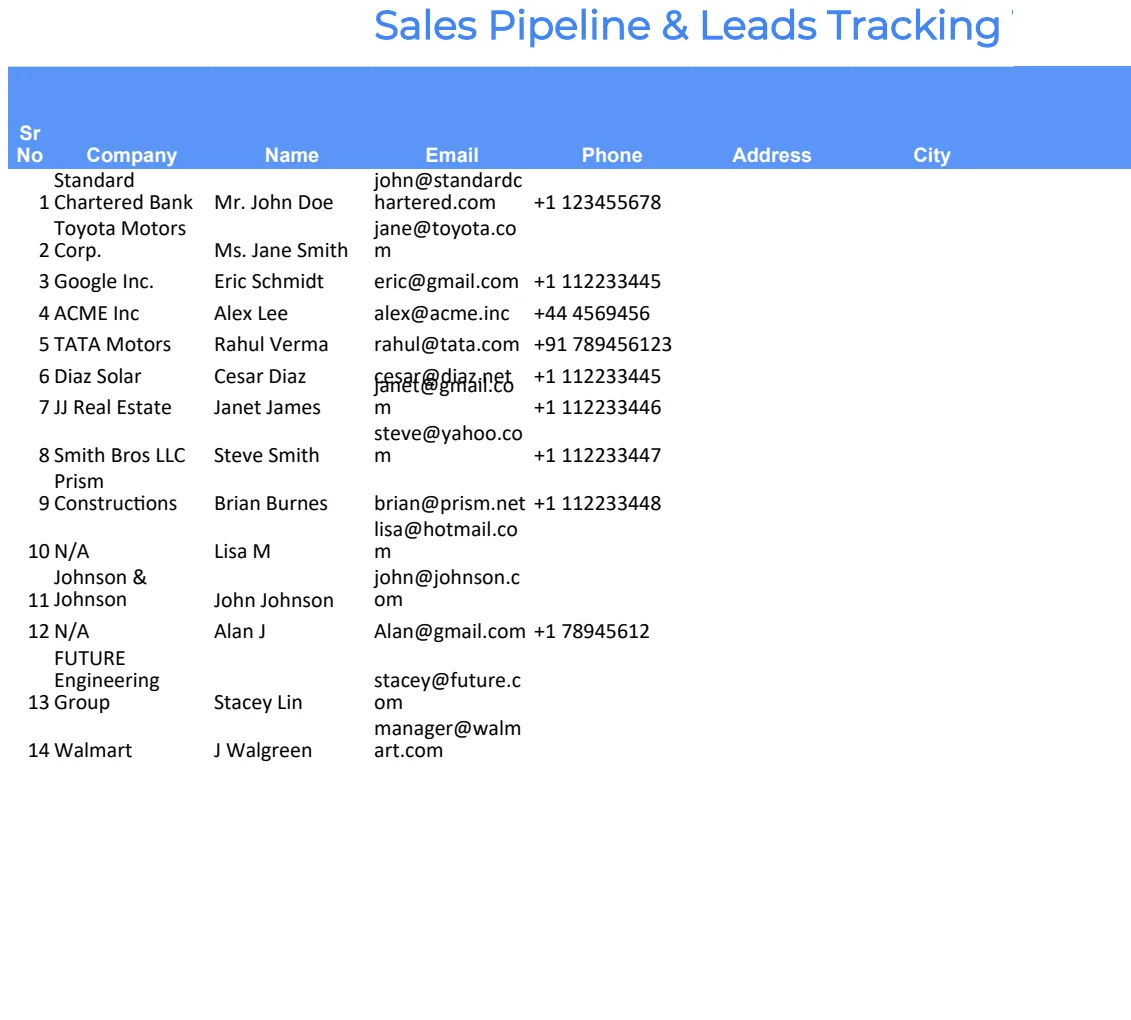
At its heart, a sales tracker needs to capture key information about each prospect or deal. Think of it as your central hub for all sales-related activity. You'll want columns for:
- Company Name: The name of the business you're engaging with.
- Contact Person: The primary individual you're speaking to.
- Email/Phone: Essential contact details.
- Lead Source: How did this lead find you? (e.g., Website Inquiry, Referral, Cold Outreach, Event). This is vital for understanding marketing ROI.
- Deal Value: The estimated or actual revenue from this sale.
- Stage: Where is the deal in your sales process? (e.g., Prospecting, Qualified, Proposal Sent, Negotiation, Closed Won, Closed Lost).
- Close Date (Estimated/Actual): When do you expect to close, or when did you close?
- Next Action: What's the immediate next step you or your team needs to take?
- Next Action Date: When should that step be completed?
- Status: A quick indicator (e.g., Active, On Hold, Completed).
- Notes: A free-form field for any important details.
These columns form the backbone. You can, and probably should, add more based on your specific business needs. For instance, if you sell multiple products, you'll want a column for Product/Service. If you have a sales team, you'll need a Sales Rep column.
Setting Up Your Spreadsheet
Let's build a functional tracker from scratch. Open a new spreadsheet, Excel or Google Sheets works perfectly.
- 01Create Your Header Row: In the first row (Row 1), enter the column names listed above. Make them descriptive. For example, instead of just "Value," use "Deal Value ($)". Bold this row for clarity.
- 02Format Your Columns:
- For
Deal Value, format the column as Currency. - For dates (
Close Date,Next Action Date), format as Date. - For
Stage,Lead Source, andStatus, consider using Data Validation to create dropdown lists. This ensures consistency and prevents typos. To do this in Excel: Select the column, go to Data > Data Validation > Allow: List, and enter your options separated by commas (e.g., "Prospecting,Qualified,Proposal Sent,Negotiation,Closed Won,Closed Lost"). In Google Sheets, it's Data > Data validation > Add rule > Criteria: Dropdown.
- 03Enter Sample Data: Populate a few rows with imaginary deals. This helps you visualize how the tracker will look and test your formatting. Include a mix of stages, values, and sources.
- 04Add Basic Formulas (Optional but Recommended):
- Total Revenue: In a cell below your
Deal Valuecolumn (e.g., if your values are in column F, and data goes down to row 100, put=SUM(F2:F100)in F101), you can calculate total potential or realized revenue. - Deals by Stage: Use a
COUNTIFSformula to count how many deals are in each stage. For example, if your stages are in column G and you want to count "Proposal Sent" (which might be in cell G5), the formula would be=COUNTIFS(G2:G100, "Proposal Sent").
- 05Conditional Formatting: Make your tracker dynamic.
- Highlighting Deal Stages: Select your
Stagecolumn (e.g., G2:G100). Go to Conditional Formatting. Set a rule: "If cell value is equal to 'Closed Won', format with green fill." Add another rule: "If cell value is equal to 'Closed Lost', format with red fill." You can add more colors for other stages. - Highlighting Overdue Actions: If you have a
Next Action Datecolumn (e.g., column I), you can highlight rows where theNext Action Dateis in the past and theStatusis not "Completed." The formula might look something like=AND(I2<TODAY(), H2<>"Completed")whereH2is yourStatuscolumn.
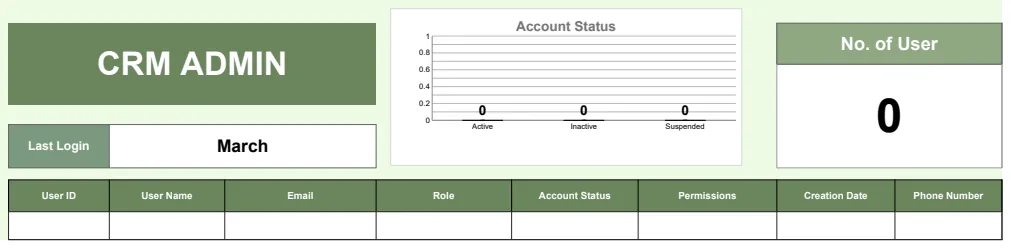
This setup provides a solid foundation. For more advanced needs, like tracking team performance or visualizing your pipeline, a dedicated template can save significant setup time. The Sales Team Performance, Pipeline & Tracker is a great example that consolidates many of these elements.
Handling Different Sales Scenarios
Your tracker needs to adapt to your business.
Product-Based Sales
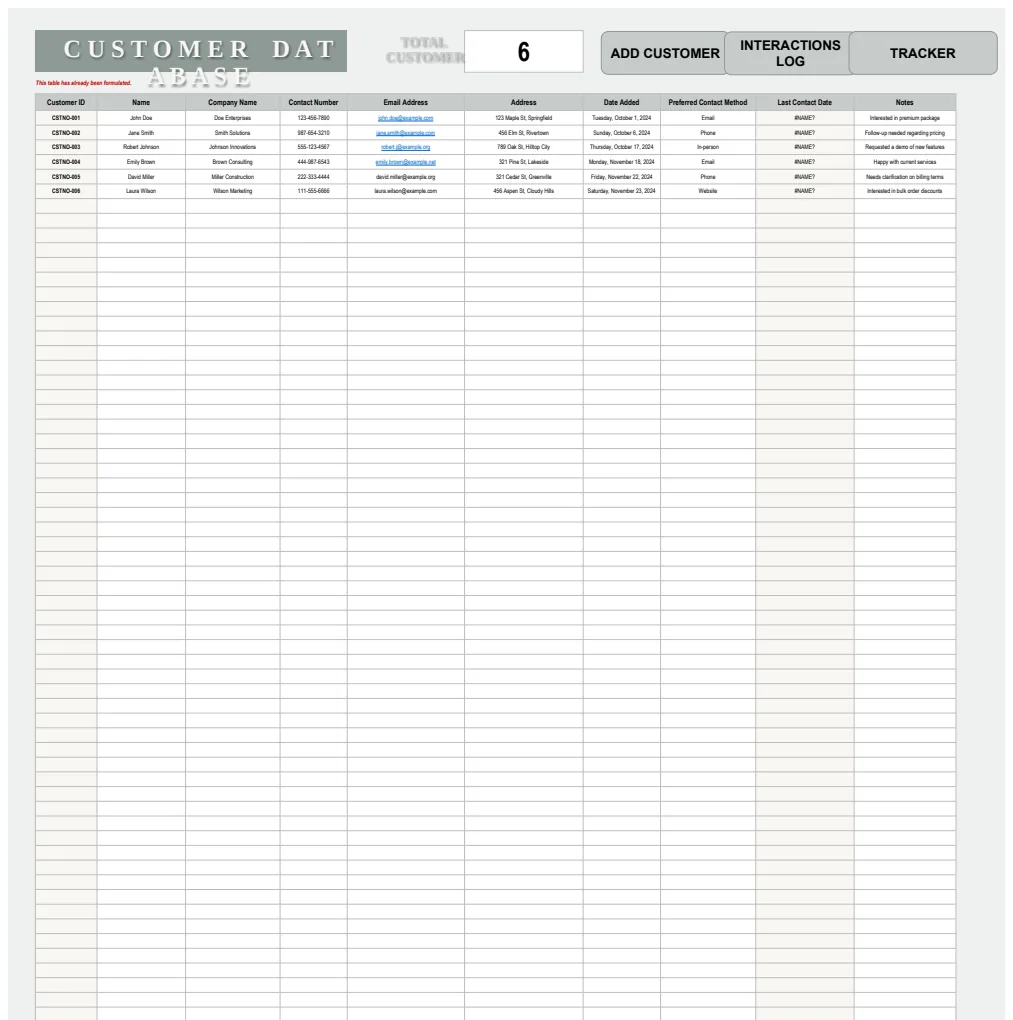
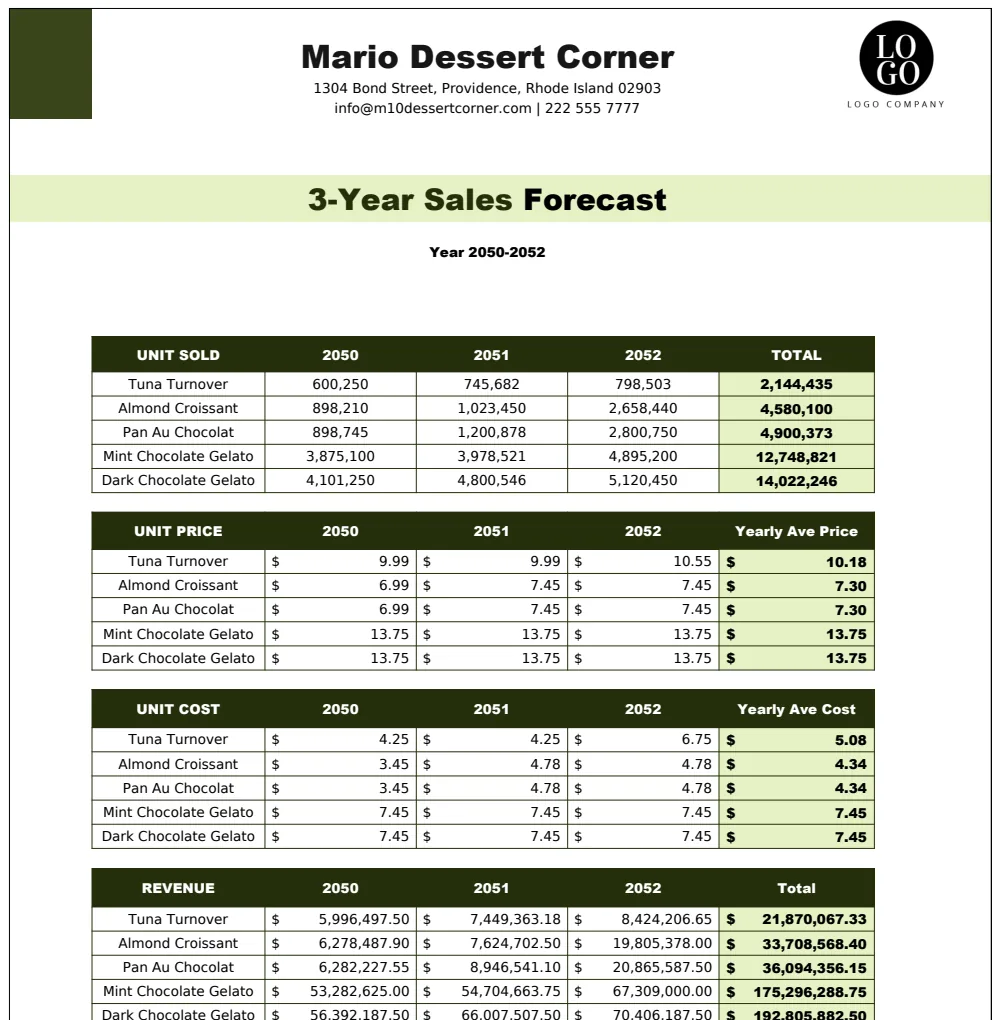
If you sell distinct products or services, you'll need to incorporate that information. Add a Product/Service column. You might then want to track revenue and profitability per product. This is where a template like the Sales Tracker & Product Sales Data becomes incredibly useful, as it often includes pre-built calculations for these metrics. You could then use pivot tables or SUMIFS to analyze which products are selling best.
Service-Based Sales & Projects
For service businesses, the "product" is often a project or a retainer. Your Deal Value might be an estimate. The Stage might include steps like "Discovery," "SOW Drafted," "Client Review," or "Project Kick-off." The Next Action is critical here, often involving scheduling meetings, sending documents, or assigning resources.
Recurring Revenue (SaaS, Subscriptions)
If you deal with subscriptions, you'll need to track not just the initial sale but also the recurring value. Consider columns for Subscription Term (Monthly, Annual), MRR (Monthly Recurring Revenue), and ARR (Annual Recurring Revenue). You'll also want to pay close attention to Churn Rate (though this is usually an output of aggregated data, not a single row entry). The Quarterly Sales Volume Tracker could be adapted to monitor MRR/ARR trends over time.
Automating and Enhancing Your Tracker
While manual entry is the starting point for any sales tracker spreadsheet template free, automation can significantly boost efficiency.
- Data Validation: As mentioned, dropdowns for
Stage,Lead Source, andStatusare a must. They enforce consistency and speed up data entry. - Formulas for Calculations: Use
SUM,AVERAGE,COUNTIFS, andSUMIFSto derive insights. For example,=AVERAGEIFS(E2:E100, G2:G100, "Closed Won")could show the average deal value for successfully closed deals. - Pivot Tables: For larger datasets, pivot tables are invaluable. They allow you to quickly summarize sales by rep, by product, by lead source, or by month without complex formulas.
- Charts and Graphs: Visualizations bring your data to life. Bar charts showing sales by source, line graphs showing revenue trends over time, or funnel charts visualizing your pipeline stages can make complex information easy to digest. Most spreadsheet software has built-in charting tools that can pull data directly from your tracker.
Common Mistakes to Avoid
Even with a great sales tracker spreadsheet template free, users often fall into common traps:
- Inconsistent Data Entry: Typos in company names, variations in stage names (e.g., "Proposal" vs. "Proposal Sent"), or missing values will break your analysis. Strict adherence to data validation rules is key.
- Outdated Information: A tracker is only as good as its data. Failing to update deal statuses, next actions, or close dates renders it useless. Schedule time regularly to maintain it.
- Overly Complex Design: Trying to track too many obscure metrics from day one can lead to a tracker that’s difficult to use and maintain. Start with the essentials and add complexity gradually.
- Not Tracking "Lost" Deals: It’s tempting to only focus on wins, but understanding why deals are lost is critical for improving your sales process. Ensure you have a clear "Closed Lost" stage with a field to note the reason.
- Ignoring Lead Source Data: If you don't know where your best leads come from, you can't effectively allocate marketing or sales efforts. Always capture and analyze this.
Frequently Asked Questions
What's the best way to track my sales pipeline?
The best way involves a combination of clear stages, regular updates, and a tool that visualizes your progress. A spreadsheet like the Sales Pipeline & Funnel Tracker can help you see your deals moving from one stage to the next, highlighting potential bottlenecks. The key is consistent data entry and a clear definition of what each pipeline stage means for your business.
How do I calculate my average deal size?
To calculate average deal size, you'll need a column for the value of each deal (e.g., "Deal Value"). Then, you sum up all the values of your closed-won deals and divide by the number of closed-won deals. In a spreadsheet, if your deal values are in column E and your stage is in column G, you'd use a formula like =AVERAGEIFS(E2:E100, G2:G100, "Closed Won").
Can a spreadsheet really replace a CRM?
For very small businesses or individuals, a well-structured spreadsheet can absolutely function as a CRM for tracking leads and deals. It's cost-effective and highly customizable. However, as your sales volume grows, or if you need features like automated email follow-ups, advanced reporting, or team collaboration tools, a dedicated CRM becomes more advantageous. Many find that starting with a template provides a good balance before committing to more complex software.
Where can I find more advanced sales tracking templates?
If you've outgrown a basic setup, you can find templates designed for specific needs. Some libraries offer templates that integrate sales tracking with forecasting, commission calculations, or advanced product analysis. The OpenWorksheet library has a range of options, including the Sales Team Performance, Pipeline & Tracker, which offers a more robust solution for growing teams. Access to the entire library is available for a one-time fee.