Excel vs. Google Sheets: Your next sales forecast
Avoid common forecasting pitfalls by moving beyond static templates and focusing on your sales pipeline.
The most common reason sales forecasts in spreadsheets fail is using static, year-over-year growth percentages instead of a pipeline-driven approach. This often happens when people search for a "sales forecast template Excel free" and download a generic model that doesn't account for the actual sales process. A truly useful forecast reflects the deals currently in your pipeline, their probabilities, and their expected close dates.
Without this granular detail, you're essentially guessing. You might know you want to grow revenue by 20%, but that number means little if your sales team is struggling to close deals or if your lead generation has dried up. The goal isn't just to hit a number; it's to understand how you'll hit it, based on real sales activity.
Building a Pipeline-Driven Forecast
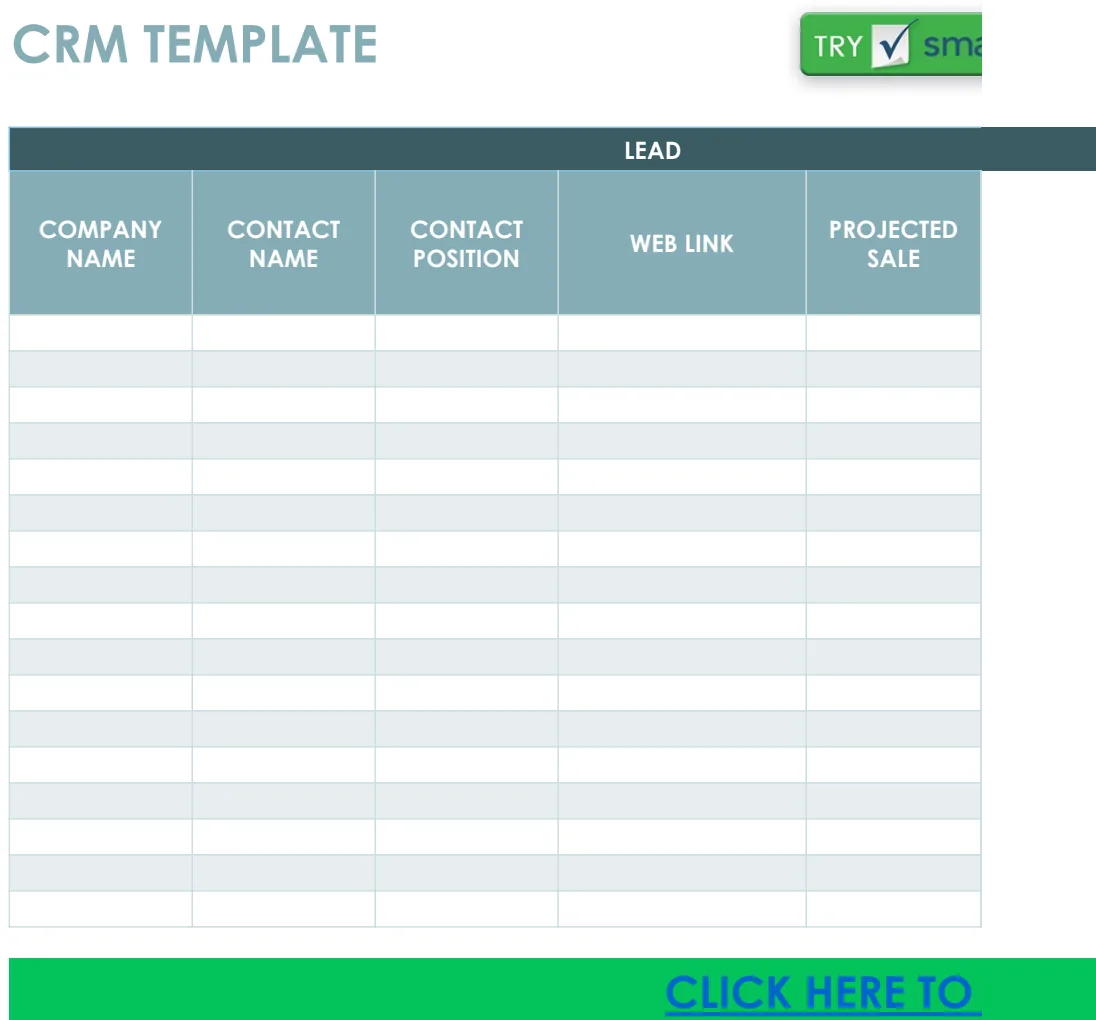
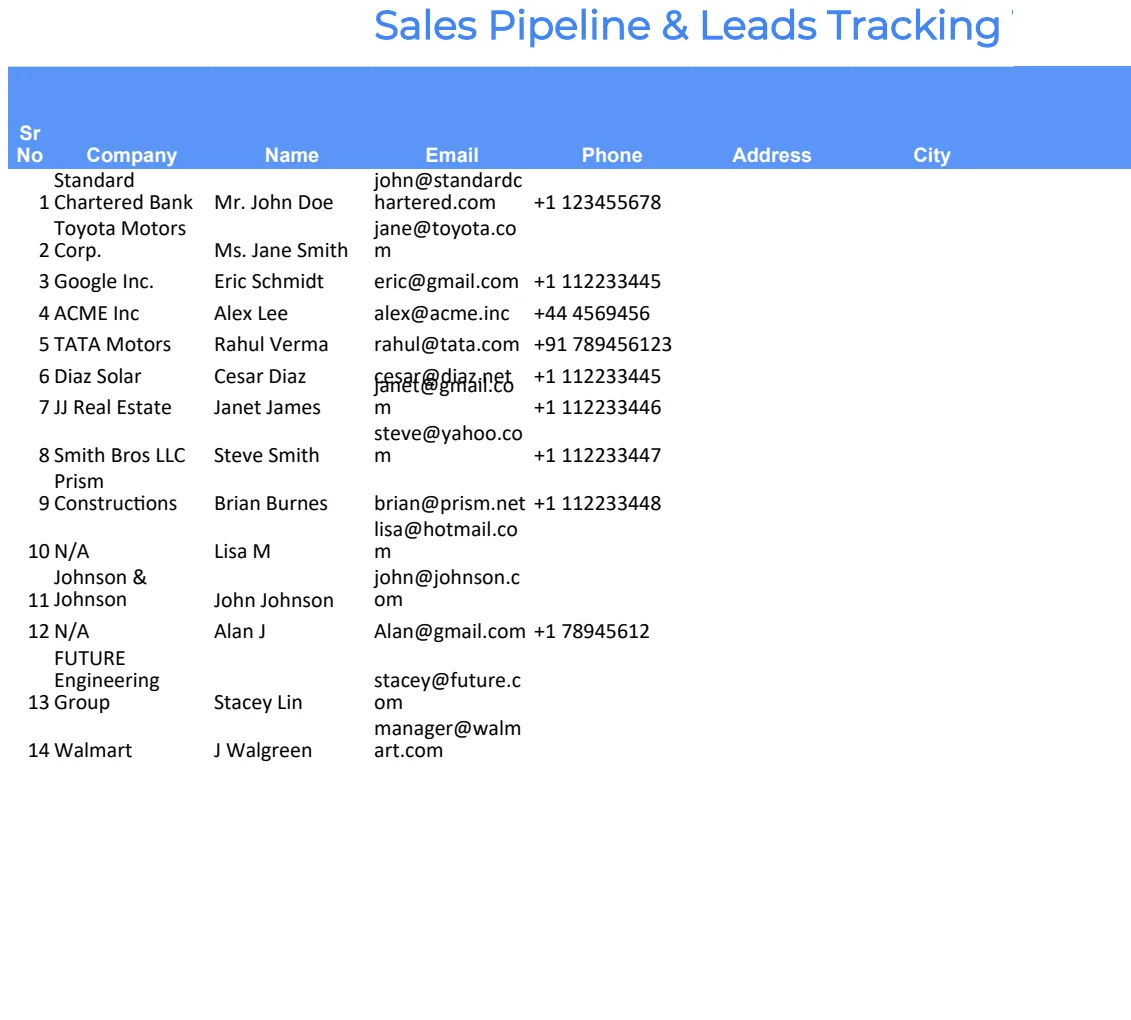
A pipeline-driven forecast starts with your sales funnel. This means tracking leads from initial contact through to a closed deal, assigning a probability to each stage, and estimating the deal value. Column headers in your sheet might look something like this:
- Lead Name/Company: Identifies the potential customer.
- Deal Value: The estimated revenue from this deal.
- Close Date: When you realistically expect the deal to close.
- Sales Stage: Where the deal is in your process (e.g., Prospecting, Qualification, Proposal, Negotiation, Closed Won, Closed Lost).
- Probability (%): The likelihood of closing the deal, often tied to the sales stage.
- Weighted Value: Calculated as
Deal Value * Probability (%).
By summing the "Weighted Value" for all deals expected to close within a specific period (e.g., the next month, quarter, or year), you get a much more realistic revenue forecast. This approach moves beyond simple extrapolation and grounds your projections in the actual work your sales team is doing.
Essential Columns for Your Forecast Sheet
Let's drill down into the critical columns you'll need for an effective sales forecast. Imagine you're setting up a sheet to track opportunities for the next 12 months.
- Opportunity ID: A unique identifier for each potential deal. This is crucial for tracking and referencing.
- Account Name: The name of the company you're selling to.
- Contact Person: The primary individual you're working with.
- Product/Service: What you are selling.
- Estimated Close Date: The date you anticipate the deal will be finalized. This is a key driver for your monthly or quarterly forecasts.
- Deal Value (USD): The total potential revenue for this opportunity.
- Current Stage: The current phase of the sales process. Use a dropdown list for consistency. Common stages might be:
- Lead In
- Qualified
- Proposal Sent
- Negotiation
- Closed Won
- Closed Lost
- Probability (%): The likelihood of winning the deal. This is often directly linked to the "Current Stage." For instance, "Closed Won" is 100%, "Negotiation" might be 75%, "Proposal Sent" 50%, and "Qualified" 25%.
- Weighted Value (USD): This is the core of your forecast. It's calculated by multiplying "Deal Value" by "Probability (%)". For example, a $10,000 deal with a 50% probability has a weighted value of $5,000.
- Sales Rep: The team member responsible for the opportunity.
- Next Step: What action needs to be taken next to move the deal forward.
- Notes: Any relevant details about the opportunity.
A well-structured sheet with these columns will provide a clear view of your sales pipeline and its projected financial impact.
Calculating Weighted Value: The Formula
The "Weighted Value" is the engine of your pipeline forecast. If your columns are set up as described above, with "Deal Value" in column F and "Probability (%)" in column H, your formula in column I (let's say, for row 2) would look like this:
=F2 * H2
If your probability is stored as a percentage (e.g., 50%), Excel or Google Sheets will automatically treat it as 0.50 in the calculation. If you've entered it as a whole number (e.g., 50), you might need to divide by 100:
=F2 * (H2 / 100)
It's generally better to store probabilities as percentages directly in the cell. This makes your sheet cleaner and the formulas simpler. Ensure your "Probability (%)" column is formatted as a percentage.
Forecasting by Month or Quarter
Once you have your "Weighted Value" calculated for each opportunity, you need to aggregate it by time period. Assuming your "Estimated Close Date" is in column E, you can use the SUMIFS function to pull together the weighted values for specific months.
Let's say you have a separate summary table where row 1 contains your months (e.g., "Jan 2024", "Feb 2024", etc.) and you want to forecast the weighted value for each month. In the cell under "Jan 2024" (let's assume this is cell B2 in your summary table), and if your opportunity data is on Sheet1 with columns E (Close Date) and I (Weighted Value), the formula would be:
=SUMIFS(Sheet1!$I:$I, Sheet1!$E:$E, ">="&B$1, Sheet1!$E:$E, "<="&EOMONTH(B$1, 0))
This formula does the following:
Sheet1!$I:$I: This is the range containing the "Weighted Value" you want to sum. The dollar signs make this range absolute, so it doesn't change when you drag the formula.Sheet1!$E:$E: This is the range containing your "Estimated Close Date".">="&B$1: This condition ensures you're only summing opportunities closing on or after the start of the month specified in cell B1."<="&EOMONTH(B$1, 0): This condition ensures you're only summing opportunities closing on or before the last day of the month specified in B1.EOMONTH(B$1, 0)calculates the end of the month for the date in B1.
You can then drag this formula across for all your months. For quarterly forecasts, you would adjust the date criteria to cover the three months of that quarter. This dynamic approach provides a much more accurate "sales forecast template Excel free" style output than static growth models.
Visualizing Your Forecast
Numbers on a spreadsheet are good, but a visual representation can be much more powerful. Once your monthly or quarterly weighted values are calculated, you can create charts to see trends and potential shortfalls.
A simple column chart showing "Month" on the x-axis and "Weighted Value" on the y-axis is a great starting point. This allows you to quickly spot seasonality or growth patterns. You can also add a line for your actual sales figures once they come in to compare against your forecast.
If you want to visualize the confidence level in your pipeline, consider a stacked column chart. Each column represents a month, and it's divided into segments representing the different sales stages, with their corresponding weighted values. This shows not just the total forecast, but also how much of it is based on early-stage versus late-stage opportunities. For those looking to convert lead data into sales forecasts with visual charts, a template like the Forecasted Sales from Leads can be very helpful.
Common Mistakes to Avoid
When building or using a sales forecast template, a few common pitfalls can derail accuracy:
- Ignoring Probability: Simply summing all deal values without considering their probability of closing. This leads to wildly inflated, unrealistic forecasts.
- Outdated Pipeline Data: Failing to regularly update the sales stages and probabilities of your opportunities. A forecast is only as good as the data feeding it.
- Fixed Close Dates: Setting "Estimated Close Dates" that are never adjusted. Deals slip, and your forecast needs to reflect that reality.
- Not Differentiating Products/Services: Treating all sales as homogenous. Different products or services may have different sales cycles, probabilities, and deal sizes.
- Forgetting Lost Deals: Not properly marking deals as "Closed Lost" or analyzing why they were lost. This misses crucial insights into sales process weaknesses.
- Overly Optimistic Assumptions: Using probabilities that are too high for early-stage deals, or assuming all leads will eventually convert.
A robust sales forecast requires diligent data management and realistic assumptions.
Advanced Forecasting Techniques and Next Steps
While a pipeline-driven forecast is a significant improvement, there are ways to enhance it further.
Using Historical Data
Your historical sales data is a goldmine. Analyze past deals to understand:
- Average deal value by product or customer segment.
- Typical sales cycle length.
- Conversion rates between sales stages.
This data can inform the probabilities you assign to current opportunities and help you refine your "Estimated Close Dates."
Forecasting for Multiple Projects
If your business involves distinct projects, each with its own revenue stream and timeline, you'll need a more specialized approach. A template designed for tracking multiple projects, like the 12 Month Sales Forecast Multiple Projects, can help segment your forecast by project, making it easier to manage resource allocation and client expectations. This moves beyond a simple company-wide forecast to a granular, project-level view.
When to Consider a Longer Time Horizon
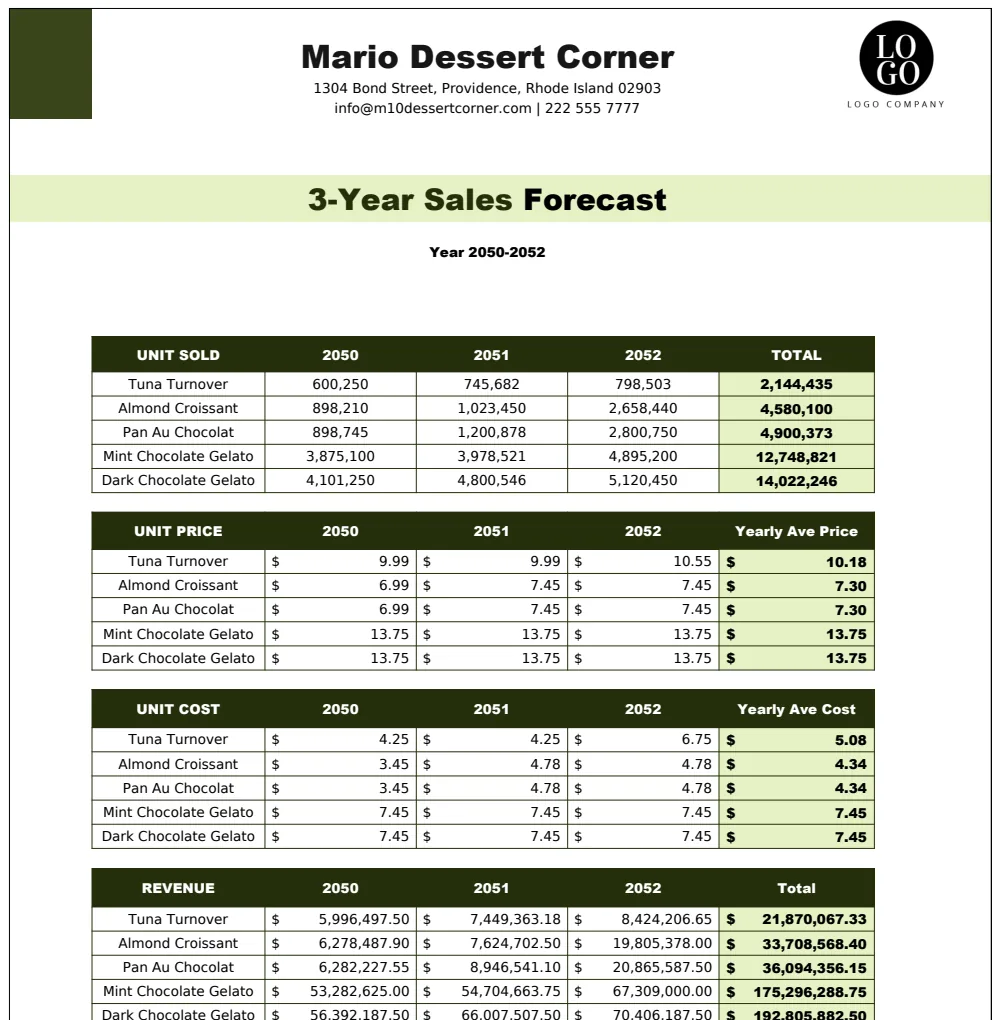
While a 12-month forecast is common, some businesses, especially those with long sales cycles or significant upfront investment, benefit from looking further out. A 3 Year Sales Forecast Template can provide strategic insights into long-term revenue potential, capacity planning, and investment needs. This allows for more strategic decision-making rather than just short-term tactical adjustments.
What if my business has highly variable deal sizes?
Use weighted value as described. If deal sizes fluctuate wildly, focus on the probability-adjusted revenue. You might also consider segmenting your forecast by deal size ranges (e.g., small, medium, large) to see if certain size categories have different conversion rates or cycle lengths.
How often should I update my forecast?
Ideally, you should update your pipeline data daily or at least weekly. The forecast itself can then be reviewed and adjusted weekly or bi-weekly. This ensures your projections are always based on the most current information available.
What if I have a very simple sales process?
Even with a simple process, tracking opportunities through a few defined stages (e.g., Lead, Qualified, Closed) and assigning probabilities will still yield a more accurate forecast than a static growth percentage. The core principle is to base your forecast on expected future activity, not just past trends.