Build your project tracker in Excel in under an hour
Discover how to build a project tracker in Excel that actually works, starting with the crucial 'Status' column.
The "Status" column is often the most critical, yet most neglected, part of a project tracker. If it’s not clear, consistently updated, and actionable, your whole system falls apart. A simple dropdown list with options like "Not Started," "In Progress," "Blocked," and "Completed" is a good start, but you'll need to define what each means precisely. This is the foundation of how to build a project tracker in Excel that actually gets used.
You’re likely here because you’re juggling multiple tasks, deadlines are looming, and you need a clearer picture of where everything stands. Manually tracking projects across emails, sticky notes, and various documents is a recipe for missed deadlines and overlooked dependencies. Building a dedicated project tracker in Excel or Google Sheets offers a centralized, customizable solution. You can tailor it precisely to your workflow, whether you’re managing a complex software development cycle or coordinating a small marketing campaign.
Designing Your Project Tracker Spreadsheet
Before you even type a single formula, sketch out the core information you need to capture for each project or task. Think about the lifecycle of a typical project you manage. What are the key milestones? Who is responsible? What are the critical dates?
Here’s a foundational set of columns that works for many scenarios:
- Project/Task Name: A clear, concise description of the item being tracked.
- Project Lead/Owner: The person primarily responsible for its completion.
- Start Date: When the work is planned to begin.
- Due Date: The target completion date.
- Status: As discussed, a dropdown with predefined options (e.g., Not Started, In Progress, Pending Review, Blocked, Completed).
- Priority: High, Medium, Low. This helps in resource allocation and focus.
- Progress (%): A numerical representation of completion. This can be manual or derived if you break down tasks further.
- Notes/Comments: A space for essential context, updates, or roadblocks.
- Dependencies: What other tasks or projects must be completed before this one can start or finish?
- Completion Date: The actual date the project or task was finished.
This structure provides a solid backbone for how to build a project tracker in Excel. You can always add more columns later, like "Budget Allocated," "Actual Spend," "Client Name," or "Phase," depending on your specific needs.
Setting Up Data Validation for Status and Priority
Consistency is king in any tracking system. To ensure your "Status" and "Priority" columns are used correctly, implement data validation.
- 01Select the Cells: Highlight the entire column (or the range of cells) where you’ll enter the status or priority for your tasks. For example, select cells
F2:F100for the "Status" column, assuming your headers are in row 1. - 02Open Data Validation:
- In Excel: Go to the "Data" tab, and in the "Data Tools" group, click "Data Validation."
- In Google Sheets: Go to "Data" > "Data validation."
- 03Choose "List": Under the "Settings" tab (Excel) or "Criteria" section (Google Sheets), select "List" from the "Allow" dropdown.
- 04Enter Your Options: In the "Source" box (Excel) or the "Item list" field (Google Sheets), type your options, separated by commas. For "Status," you might enter:
Not Started,In Progress,Blocked,Pending Review,Completed. For "Priority," you could enter:High,Medium,Low. - 05Confirm: Click "OK" (Excel) or "Done" (Google Sheets).
Now, when you click into any of those cells, a dropdown arrow will appear, allowing you to select from your predefined list. This prevents typos and ensures uniformity, making filtering and reporting much easier.
Calculating Project Progress and Remaining Time
Quantifying progress and understanding how much time is left can be powerful. You can use simple formulas for this.
- Days Remaining: This formula calculates the number of days between today and the due date. Assuming your "Due Date" is in column D, you’d use:
=IF(D2="","",MAX(0,D2-TODAY())) This formula checks if the due date cell is empty. If it is, it leaves the cell blank. Otherwise, it subtracts today's date from the due date. MAX(0, ...) ensures you don't get negative numbers if a deadline has passed.
- Progress Bar (Conditional Formatting): While not a formula in a cell, you can visually represent progress. Select your "Progress (%)" column, go to Conditional Formatting, and choose "Data Bars." You can set the minimum to 0 and the maximum to 100 to create a visual bar that fills up as the percentage increases.
For more complex project breakdowns, you might have a "Sub-Tasks Completed" column and a "Total Sub-Tasks" column. The "Progress (%)" could then be calculated as: =IF(E2=0,"",D2/E2) (assuming "Sub-Tasks Completed" is in D2 and "Total Sub-Tasks" is in E2).
Tracking Project Milestones with Dates
Beyond just start and due dates, tracking key milestones can provide a granular view of progress. You might add columns like "Design Approval Date," "Development Complete Date," "User Acceptance Testing (UAT) Sign-off," etc.
The real power comes when you link these dates. For instance, you can use formulas to automatically update the "Due Date" of a subsequent task once a milestone is reached. This can get intricate, but a simpler approach is to use conditional formatting to highlight upcoming or overdue milestones.
- Highlighting Tasks Due Soon: Select your "Due Date" column. Go to Conditional Formatting > New Rule. Choose "Use a formula to determine which cells to format." Enter a formula like:
=AND(D2<>"",D2-TODAY()<=7,D2>=TODAY()) This highlights due dates that are within the next 7 days and have not yet passed. You can set the formatting to a yellow fill.
- Highlighting Overdue Tasks: Use a similar rule with the formula:
=AND(D2<>"",D2<TODAY(),D2<>"") This highlights any due dates that are in the past and not blank. Set the formatting to red.
This visual cueing is a critical part of effectively how to build a project tracker in Excel.
Identifying and Managing Blocked Tasks
A "Blocked" status is a signal. It means work cannot proceed as planned, and intervention is needed. Your tracker should make these immediately obvious.
- 01Conditional Formatting for "Blocked": Apply conditional formatting to the entire row (or at least the "Status" column) when the "Status" cell contains "Blocked."
- Select all your data rows (e.g.,
A2:J100). - Go to Conditional Formatting > New Rule > "Use a formula to determine which cells to format."
- Enter the formula:
=$F2="Blocked"(assuming "Status" is column F and your data starts on row 2). - Set the format to a distinct color, like a bright red fill.
- 02Review Regularly: Schedule a recurring time (daily or weekly) to review all tasks marked as "Blocked." The "Notes/Comments" column is vital here for understanding why it's blocked and what steps are needed to unblock it.
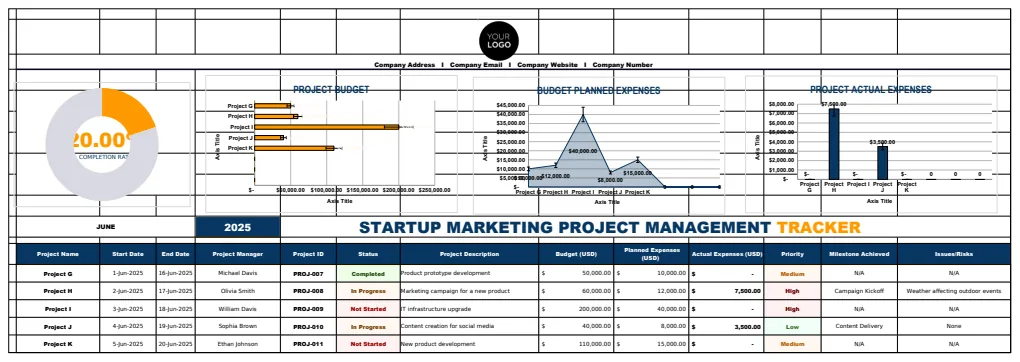
If you manage multiple marketing projects for a startup, a template like the Startup Marketing Project Management Tracker Template can provide pre-built structures for managing these statuses and dependencies.
Advanced Techniques: Formulas and Pivot Tables
Once your data is entered consistently, you can extract powerful insights.
- SUMIFS and COUNTIFS: These are your best friends for summarizing data.
- Count of Projects by Status:
=COUNTIFS(F:F, "In Progress")(assuming Status is column F). - Count of Overdue Projects:
=COUNTIFS(D:D, "<"&TODAY(), F:F, "<>Completed")(assuming Due Date is column D and Status is column F). - Count of Projects by Lead and Status:
=SUMIFS(C:C, B:B, "John Doe", F:F, "In Progress")(assuming a hypothetical "Count" column C, Lead in B, Status in F). - Pivot Tables: For a dynamic overview, Pivot Tables are indispensable.
- 01Select your entire data range, including headers.
- 02Go to "Insert" > "PivotTable."
- 03Choose where to place the PivotTable (New Worksheet is usually best).
- 04Drag and drop fields:
- Put "Project Lead/Owner" in the "Rows" area.
- Put "Status" in the "Columns" area.
- Put "Project/Task Name" in the "Values" area and change the summarization to "Count."
This instantly gives you a cross-tabulation of how many tasks each person has in each status. You can easily change the fields to analyze by priority, project type, or phase.
Common Mistakes to Avoid
Even with a solid understanding of how to build a project tracker in Excel, pitfalls exist.
- Over-Complication: Starting with too many columns, complex formulas, or rigid structures. Begin simple and add complexity only when a clear need arises.
- Inconsistent Data Entry: Not using data validation, allowing variations in spelling for statuses or names. This kills your reporting.
- Lack of Ownership: Nobody is assigned responsibility for updating the tracker, or the updates are infrequent. If it's not current, it's useless.
- Ignoring "Blocked" Statuses: Marking tasks as blocked but not following up to resolve the issues. The tracker becomes a graveyard of problems, not a tool for solutions.
- Not Reviewing the Data: Building a tracker but never using the insights it provides. The value is in the analysis, not just the data collection.
What if I have very different types of projects?
If you manage vastly different project types (e.g., construction vs. marketing), you might need separate trackers or a highly flexible single tracker. For construction, a template like the Building Construction Project Budget Template might be more appropriate for financial tracking, while a marketing-focused one suits campaign management. You can add a "Project Type" column to a single tracker and then use Pivot Tables or filters to segment your data.
Can I track time spent on projects?
Yes. You can add columns for "Time Spent (Hours)" and "Estimated Time (Hours)." You can manually enter time spent, or for more advanced setups, explore integration with time-tracking software or use more complex Excel features like VBA macros if you have specific needs. For basic tracking, simply adding these columns and using SUM formulas can give you an overview of effort.
How do I share this tracker with my team?
If you're using Excel, you can save the file to a shared network drive or a cloud storage service like OneDrive or Google Drive. For real-time collaboration and easier access, especially for remote teams, using Google Sheets is often superior. Both platforms allow you to set permissions for viewing or editing. If you need a more dedicated project management tool, consider exploring SaaS options; however, for many small teams, a well-maintained spreadsheet is perfectly adequate. Remember, the library of templates at OpenWorksheet offers various pre-built solutions, available for a one-time fee of $9 for unlimited downloads, which might save you significant setup time.