The 5 essential columns for your Google Sheets sales pipeline
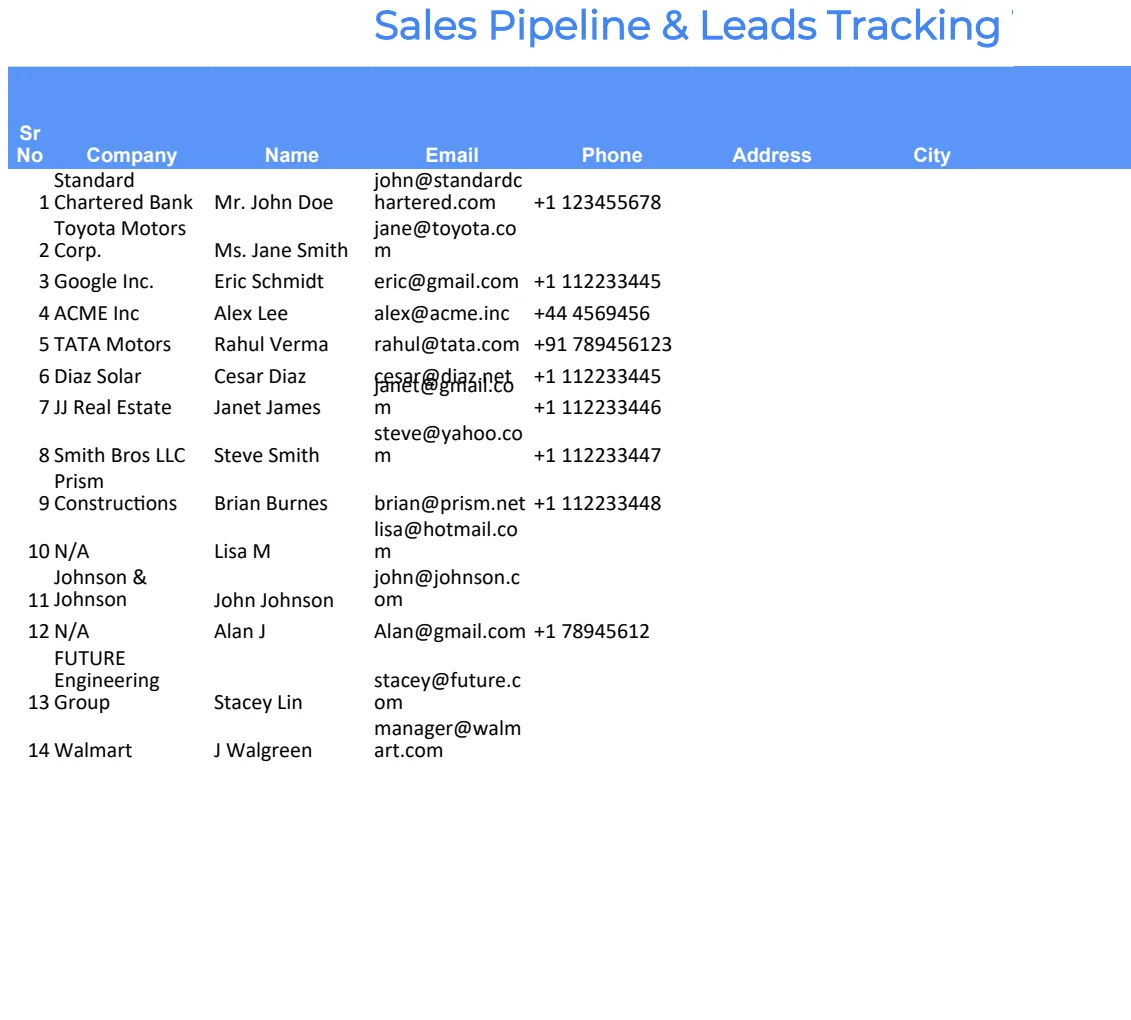
A functional sales pipeline template Google Sheets setup requires more than a simple table. It means building in the logic to track deals effectively.
The most common failure of a sales pipeline template in Google Sheets is that it becomes a static list of deals rather than a dynamic tool for forecasting and strategy. This often happens because the template lacks clear definitions for each pipeline stage, leading to inconsistent data entry and an inability to accurately measure progress or predict revenue. Without standardized stages, you can't reliably answer questions like "What's our average deal velocity?" or "How much revenue can we expect next quarter?"
Getting a functional sales pipeline template Google Sheets setup requires more than just a simple table. It means building in the logic to track not just the deal name and value, but also its probability of closing, the stage it's in, and when you expect it to move to the next stage or close. This allows you to move from simply listing opportunities to actively managing your sales process, identifying bottlenecks, and making informed decisions about where to focus your efforts. A well-designed template acts as a central hub for all your sales activity, providing visibility and actionable insights.
Defining Your Pipeline Stages
Before you even think about formulas or formatting, you need to clearly define what each stage of your sales pipeline represents. This is the bedrock of a functional system. Generic labels like "Prospecting," "Qualified," and "Closed" are a start, but they're often too vague.
Consider these more specific examples:
- Contacted: The initial outreach has been made, and there's been some form of positive response (email reply, phone call answered).
- Needs Assessment: You've had a conversation and confirmed there's a potential need for your product or service. You're exploring their pain points.
- Proposal Sent: You've presented a formal proposal or quote to the prospect.
- Negotiation: The prospect has received the proposal and is discussing terms, pricing, or specific features.
- Closed-Won: The deal is signed, and the customer is secured.
- Closed-Lost: The deal did not materialize.
The exact stages will vary based on your business model and sales cycle length. The key is that each stage has a clear, objective criterion for entry and exit. This consistency is crucial for accurate reporting.
Essential Columns for Your Sales Pipeline
A robust sales pipeline template Google Sheets needs more than just a deal name. You'll want to include columns that provide context, track progress, and enable forecasting.
Here are some fundamental columns to consider:
- Deal Name: A unique identifier for the opportunity.
- Company: The name of the prospect's company.
- Contact Person: The primary individual you're working with.
- Stage: The current stage of the deal in your pipeline (using your defined stages).
- Value: The estimated revenue for this deal.
- Probability (%): The likelihood of closing this deal, often tied to the stage but can be adjusted.
- Close Date (Expected): The projected date the deal will close (won or lost).
- Last Contact Date: The date of your most recent interaction.
- Next Action: What is the immediate next step for this deal?
- Owner: The sales representative responsible for the deal.
- Source: Where did this lead originate (e.g., Website, Referral, Event)?
- Close Date (Actual): The date the deal was actually won or lost.
You might also add columns for product interest, competitor information, or specific notes relevant to the deal.
Setting Up Your Google Sheet
Let's walk through setting up a basic but functional sales pipeline in Google Sheets.
- 01Create a New Sheet: Open a blank Google Sheet and name it something like "Sales Pipeline Tracker."
- 02Add Headers: In the first row, enter your essential column headers. For instance, starting with cell A1:
Deal Name,Company,Stage,Value,Probability (%),Expected Close Date,Owner,Source. - 03Define Stages (Data Validation): To ensure consistency, use data validation for your "Stage" column.
- Select the entire "Stage" column (or a range like
C2:C1000). - Go to
Data>Data validation. - Under
Criteria, selectList from a rangeorList of items. - If using
List of items, enter your defined stages, separated by commas (e.g.,Contacted,Needs Assessment,Proposal Sent,Negotiation,Closed-Won,Closed-Lost). - Click
Save. Now, when you click on a cell in the "Stage" column, a dropdown will appear with your predefined stages.
- 04Enter Sample Data: Populate a few rows with hypothetical deals to test your setup. Make sure to vary the stages, values, and expected close dates.
- 05Format Values: Format the "Value" column as currency. Select the column, then go to
Format>Number>Currency. - 06Format Dates: Ensure the "Expected Close Date" column is formatted as a date. Select the column, then go to
Format>Number>Date.
This provides a solid foundation. For more advanced features like automated forecasting, you might consider a template like the Sales Pipeline Analysis Template, which is built to provide deeper insights.
Calculating Potential Revenue and Deal Velocity
With your data in place, you can start extracting insights. Two crucial metrics are potential revenue and deal velocity.
Potential Revenue: This is your forecasted revenue based on deals currently in the pipeline. It's a weighted average, considering the probability of closing.
- In a new column, let's call it "Weighted Value," you can use a formula like:
=D2 * (E2/100) (Assuming "Value" is in column D and "Probability (%)" is in column E, and this formula is in row 2).
- To get your total potential revenue, you'd sum this "Weighted Value" column. You can do this in a separate summary area or by using
SUM()on the weighted column.
Deal Velocity: This measures how quickly deals move through your pipeline. It requires tracking the time spent in each stage.
- You'll need to record the
Close Date (Actual)for won and lost deals. - You might also add columns for the "Date Entered Stage" for each stage, though this can become complex to manage manually.
- A simpler approach for velocity is to calculate the average time from "Open Date" (when the deal first entered the pipeline) to "Close Date (Actual)."
- Add an "Open Date" column.
- The formula for average time in pipeline for won deals would look something like:
=AVERAGEIFS(G2:G1000, F2:F1000, ">0", H2:H1000, "Closed-Won") (Assuming "Close Date (Actual)" is in column G, "Value" is in D, "Expected Close Date" is F, "Owner" is H, and your "Close Date (Actual)" is formatted as a date. You'd adjust the date columns accordingly).
This kind of analysis is a core function of a good sales pipeline tracker. For a pre-built solution that handles these calculations, the Sales Hacker Pipeline Tracker Spreadsheet offers robust forecasting capabilities.
Visualizing Your Pipeline with Charts
Numbers are good, but visuals are often better for understanding trends. Google Sheets makes it easy to create charts from your pipeline data.
- Pipeline by Stage: To see how many deals are in each stage:
- Select your "Stage" column and your "Deal Name" column (or a count of deals per stage).
- Go to
Insert>Chart. - Choose a "Pie Chart" or a "Bar Chart." The chart editor will help you configure it to show the count of deals per stage.
- Revenue by Stage: To visualize potential revenue distribution:
- Select your "Stage" column and your "Weighted Value" column.
- Insert a "Bar Chart" or "Column Chart." This shows where your potential revenue is concentrated.
- Deals Closing This Month/Quarter:
- You can filter your "Expected Close Date" column for the relevant period and then create a bar chart of deals by owner or by stage within that timeframe.
These visualizations help you quickly identify if your pipeline is healthy, if deals are getting stuck in a particular stage, or if revenue is disproportionately weighted towards the end of the quarter.
Common Mistakes to Avoid
Even with a well-structured template, errors can creep in. Being aware of these pitfalls can save you a lot of headaches.
- Inconsistent Stage Definitions: As mentioned, this is the biggest killer of pipeline accuracy. If one person's "Qualified" means another's "Needs Assessment," your data is useless.
- Not Updating Regularly: A pipeline is a living document. If deals aren't updated daily or at least weekly, the data becomes stale and misleading.
- Overly Optimistic Probabilities: Assigning a 90% probability to a deal that's only just had an initial call will inflate your forecast. Stick to your defined probability percentages for each stage.
- Ignoring "Closed-Lost" Deals: You need to track why deals are lost. This provides invaluable feedback for improving your sales process, product, or marketing.
- No Clear "Next Action": If a deal has no defined next step, it's likely to stagnate. Ensure every active deal has a clear, actionable item assigned.
- Using the Sheet as a CRM: While a spreadsheet can track deals, it lacks the full functionality of a dedicated CRM for managing customer interactions, tasks, and broader relationship management.
For organizations needing a more robust system that integrates these tracking and management features, a template like the Sales Team Performance, Pipeline & Tracker can be a significant step up from a basic spreadsheet.
Frequently Asked Questions
How do I forecast revenue accurately with my sales pipeline?
Forecasting revenue involves summing the "Weighted Value" of all deals in your pipeline (Value * Probability %). For more granular forecasting, you'll want to group this by expected close date (e.g., by week or month) and sum the weighted values within those periods. This gives you a probabilistic forecast, not a guaranteed number.
What if my sales cycle is very long or very short?
A long sales cycle might mean you need more stages to track progress and keep deals from stalling. For shorter cycles, you might consolidate stages. The key is that the stages accurately reflect the journey of a typical deal in your specific business. You can always adjust the stages in your data validation list as your understanding evolves.
Can I track multiple products or services in one pipeline?
Yes, you can add a "Product/Service" column to your template. Then, you can use pivot tables or SUMIFS formulas to break down your pipeline value and deal counts by product. This helps you understand which offerings are driving the most opportunities.
When should I consider moving beyond a Google Sheet for my sales pipeline?
If you find yourself spending more time managing the spreadsheet than selling, or if you need advanced features like automated email follow-ups, task management, or integrations with other tools, it's likely time to explore dedicated CRM software. For a powerful, unified view of your sales process, the Sales Pipeline Tracker template can bridge the gap, offering automated management of opportunities. The OpenWorksheet library offers templates starting at a one-time fee of $9 for unlimited downloads.