10 Free Excel Budget Templates for Small Business (2026)
Small businesses face tighter margins and faster cash burn in 2026 than at any point in the past decade. 74% of small business owners reported increased costs due to inflation, and 83% operate on a ch...
Small businesses face tighter margins and faster cash burn in 2026 than at any point in the past decade. 74% of small business owners reported increased costs due to inflation, and 83% operate on a check-to-check basis without sufficient cash flow to cover unexpected expenses. A free Excel budget template gives you the structure to track every dollar without paying for software you may not need yet.
Excel remains the most popular tool for managing business finances, even with dozens of apps competing for your attention. You already own it, your accountant can read it, and you control the data without monthly subscription fees. The right template turns a blank spreadsheet into a financial dashboard in under an hour.
Why Small Businesses Need a Free Excel Budget Template in 2026
Cash flow problems kill more small businesses than bad products. You need visibility into what's coming in, what's going out, and how much runway you have before the next invoice clears. A budget template forces you to confront these numbers weekly instead of discovering problems when your bank balance hits zero.
Free templates lower the barrier to start. You can test different budget structures, customize categories for your revenue model, and build the habit of monthly reconciliation before committing to paid software. Most small businesses outgrow their first template within 18 months, which makes starting with a free version the smart move.
Current economic conditions demand tighter forecasting. With interest rates still elevated and customer spending patterns shifting faster than historical norms, your 2026 budget assumptions may already be outdated. A flexible Excel template lets you adjust projections monthly without waiting for your accountant or learning new software.
What Makes a Good Free Excel Budget Template for Small Business
A useful template saves you setup time without locking you into someone else's assumptions about your business. Look for clean layouts with clearly labeled income and expense categories, automatic calculation formulas already built in, and separate tabs for monthly tracking, annual summaries, and cash flow forecasts.
The best templates include a dashboard tab that visualizes your budget health at a glance. Charts showing income vs. expenses, burn rate, and budget variance help you spot problems faster than scanning rows of numbers. If the template requires you to manually copy totals between sheets, keep looking.
Avoid templates that try to do everything. A 47-tab workbook with pivot tables, macros, and industry-specific jargon creates more confusion than clarity. You want a template you can understand in 15 minutes and customize in an afternoon, not a financial engineering project.
Monthly vs. Annual vs. Project-Based Budget Structures
Monthly templates work best for service businesses with recurring revenue and predictable expenses. You track income and costs each month, compare actuals to projections, and adjust the next month's forecast based on what you learned. This structure keeps you close to the numbers without overwhelming you with annual planning.
Annual templates suit businesses with seasonal peaks or long sales cycles. You map out the full year's revenue and expenses, then break it into monthly or quarterly buckets. This view helps you plan for slow months, schedule major purchases during high-revenue periods, and set realistic growth targets.
Project-based templates fit agencies, consultants, and contractors who bill by engagement. You budget each project's revenue, labor costs, materials, and overhead, then roll up all active projects into a master view. This structure shows profitability per project and helps you decide which types of work to pursue more aggressively.
Must-Have Features: Automatic Calculations, Dashboards, and Forecast Tabs
Every cell that shows a total, percentage, or variance should contain a formula, not a number you type manually. SUM formulas for income and expense categories, subtraction formulas for net income, and percentage formulas for budget variance eliminate human error and update instantly when you change inputs.
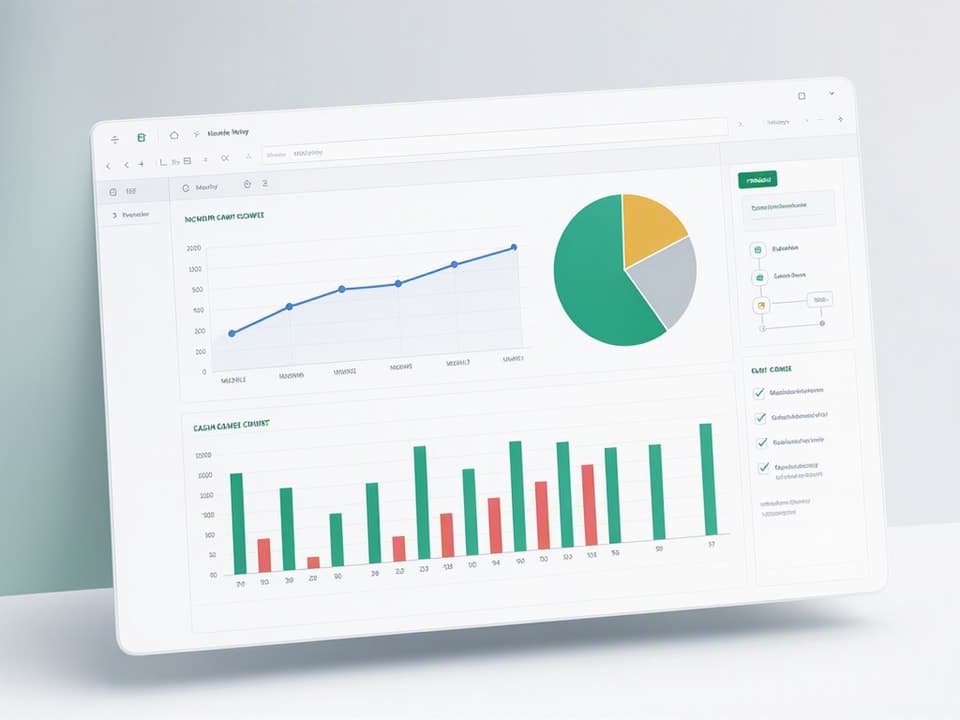
A dashboard tab should sit at the front of the workbook with charts that refresh automatically. Include a month-over-month income trend line, a pie chart of your top five expense categories, and a simple cash flow projection for the next 90 days. These visuals make budget reviews faster and help non-financial team members understand the numbers.
Forecast tabs let you model different scenarios without touching your actual numbers. Build a best-case, worst-case, and most-likely revenue forecast, then see how each scenario affects your cash position. This feature becomes critical when you're deciding whether to hire, invest in inventory, or cut discretionary spending.
Red Flags: Templates That Create More Work Than They Solve
Skip templates that require manual data entry in multiple places. If you have to type the same revenue number into three different sheets, the template designer didn't think about your workflow. Look for templates where you enter data once and formulas propagate it everywhere else.
Avoid templates with broken formulas or hardcoded numbers in cells that should calculate automatically. Open the template and click on a few total cells to check the formula bar. If you see a static number instead of a SUM or subtraction formula, you'll spend hours fixing it before you can use it.
Templates with excessive formatting, merged cells, and locked ranges slow you down. You want clean rows and columns you can sort, filter, and expand without breaking the layout. If the template feels like a finished report instead of a working document, it's not designed for daily use.
How to Choose the Right Free Excel Budget Template for Your Business Type
Your revenue model determines which template structure saves you the most time. Service businesses need templates that track billable hours and client-level profitability. Product businesses need inventory cost tracking and cost of goods sold calculations. Hybrid businesses need flexibility to handle both.
Team size matters more than you'd expect. A solo founder can manage a simple two-tab template. A business with five employees needs separate cost centers or department views to track spending by team. Templates designed for solopreneurs break down when you try to scale them.
Download two or three templates and spend 30 minutes with each before committing. Enter a month of sample data to see how the formulas behave, test the dashboard charts, and check whether the category structure matches your actual business. The template that feels intuitive after this test is the one you'll actually use.
Service-Based Businesses: Tracking Billable Hours and Client Revenue
Service businesses live or die by utilization rates and client profitability. Your budget template should include columns for billable hours, hourly rates, and revenue per client or project. Add a section for non-billable time spent on admin, sales, and internal work to see your true capacity.
Track direct costs per client separately from general overhead. If you pay contractors or freelancers for specific projects, those costs should appear on the same row as the client revenue. This layout shows gross profit per engagement and helps you identify which clients drain resources.
Include a forecast section that models different scenarios for new client acquisition. If you close two new retainers next month at $5,000 each, how does that change your cash position and hiring capacity? Service businesses need this forward-looking view because revenue can spike or drop quickly.
Product-Based Businesses: Managing Inventory Costs and COGS
Product businesses need templates that separate cost of goods sold from operating expenses. Your income section should show gross revenue, then subtract COGS to calculate gross profit before you touch overhead. This structure reveals whether your pricing covers production costs with enough margin left for growth.
Add inventory tracking columns if you hold stock. Track beginning inventory, purchases, sales, and ending inventory each month. Use these numbers to calculate inventory turnover and spot slow-moving SKUs that tie up cash. A simple aging report shows which products to discount or discontinue.
Build a separate tab for per-unit economics. List each product with its selling price, direct material cost, labor cost, and shipping cost. Calculate gross margin per unit to see which products fund your business and which ones barely break even. This analysis guides pricing decisions and product mix strategy.
Hybrid and Seasonal Businesses: Handling Variable Income Streams
Businesses with multiple revenue streams need templates that aggregate different income types into a single view. Create separate rows for product sales, service revenue, subscription income, and one-time projects. Sum these into a total revenue line, then track expenses against the combined number.
Seasonal businesses must budget for uneven cash flow. If you earn 60% of annual revenue in Q4, your monthly budget should reflect that reality. Build a rolling 12-month view that shows cumulative income and expenses, not just monthly snapshots. This perspective helps you manage cash during slow months without panicking.
Add a cash reserve target to your budget. Calculate how much you need to cover three months of fixed expenses, then track progress toward that goal. When revenue spikes, allocate a percentage to reserves before increasing discretionary spending. This discipline smooths out seasonal volatility.
Step-by-Step: Setting Up Your Free Excel Budget Template
Download the template and save it with a clear filename that includes the year and month: "2026_Business_Budget_Jan_Start.xlsx". Open the file and spend five minutes clicking through every tab to understand the layout before you change anything. Check the formula bar on calculated cells to see how totals and percentages work.
Start with the income section. Delete any placeholder categories that don't match your business and add rows for your actual revenue streams. If the template shows "Product Sales" and "Service Revenue" but you also earn affiliate income, add that row. Keep category names short and consistent with your accounting system.
Move to expenses and repeat the process. Most templates include generic categories like "Marketing" and "Rent," but you need specificity. Break marketing into "Paid Ads," "Content Creation," and "Tools/Software" if those buckets matter for your decision-making. Lump together tiny expenses that don't need individual tracking.
Step 1: Download and Audit the Template Structure
Open the template and identify which tabs contain input cells versus calculated summaries. Input tabs are where you'll enter actual numbers each month. Summary tabs pull data from input tabs using formulas. Never type numbers directly into summary tabs or you'll break the automation.
Click on a few calculated cells and read the formulas. Look for SUM functions that add up income or expense categories, subtraction formulas that calculate net income, and percentage formulas that show variance between budget and actuals. If a formula references cells on other sheets, trace those connections to understand the data flow.
Check for data validation and dropdown lists in category columns. Some templates restrict you to predefined categories, which helps maintain consistency but limits flexibility. Decide whether you want that structure or prefer open text fields you can customize freely.
Step 2: Customize Income Categories for Your Revenue Streams
Replace generic income rows with your actual revenue sources. A consulting business might have "Retainer Clients," "Project Work," and "Speaking Fees." An e-commerce store might list "Online Sales," "Wholesale Orders," and "Amazon FBA Revenue." Use names that match your invoicing system so reconciliation stays simple.
Add columns for volume metrics if they help you forecast. Service businesses can track number of clients or billable hours. Product businesses can track units sold or average order value. These metrics live alongside revenue numbers and help you spot trends that pure dollar amounts might hide.
Set up separate rows for one-time versus recurring revenue if your business has both. Recurring revenue deserves its own line because it's more predictable and valuable for forecasting. One-time project income gets its own row so you can see how much of your total revenue depends on constantly landing new deals.
Step 3: Map Your Expense Categories to Real Business Costs
Start with fixed expenses that stay the same every month: rent, insurance, software subscriptions, loan payments. List these first because they represent your baseline burn rate. Sum them into a "Total Fixed Expenses" row so you know the minimum you must cover each month.
Add variable expenses that change with revenue or activity: materials, contractor payments, shipping costs, transaction fees. Group these logically so you can see patterns. If shipping costs spike one month, you want to spot it quickly without digging through 40 line items.
Create a miscellaneous or discretionary category for small irregular expenses, but cap it at 5-10% of total expenses. If miscellaneous grows larger, break out the biggest items into their own rows. This category should capture true one-offs, not recurring costs you haven't named properly.
Step 4: Set Up Formulas for Gross Profit, Net Income, and Cash Flow
Gross profit equals total revenue minus cost of goods sold. If you're a service business without COGS, gross profit equals total revenue. Add a clearly labeled row for this calculation and use a simple subtraction formula: =Total_Revenue-Total_COGS. Format it in bold so it stands out.
Net income equals gross profit minus all operating expenses. Create another subtraction formula: =Gross_Profit-Total_Operating_Expenses. This number tells you whether you're profitable each month. If net income is negative, you're burning cash and need to adjust quickly.
Cash flow tracking requires a beginning balance, additions from income, subtractions for expenses, and an ending balance. Start with your actual bank balance at the beginning of the month. Add total revenue received (not billed), subtract total expenses paid (not accrued), and calculate the ending balance. This view shows liquidity, not just profitability.
Step 5: Build a Monthly Update Routine
Block 60 minutes on your calendar at the end of each month to update the budget. Pull your bank statements, credit card statements, and invoicing records. Enter actual income and expenses into the appropriate rows, then compare actuals to your budget projections.
Calculate variance for each major category. If you budgeted $2,000 for marketing and spent $2,800, that's a $800 or 40% overage. Document why the variance happened in a notes column. Did you run an unplanned ad campaign, or did costs creep up gradually? Understanding causes helps you forecast better.
Use this month's actuals to adjust next month's budget. If revenue came in 15% below projection, lower your expense budget to match. If a new client signed a retainer, increase revenue projections and allocate the extra income to specific growth investments. Your budget should evolve monthly, not stay static all year.
Essential Excel Formulas Every Small Business Budget Needs
You don't need advanced Excel skills to run a functional budget. Six formulas cover 90% of what small businesses need: SUM, AVERAGE, percentage calculations, IF statements, VLOOKUP or XLOOKUP, and basic subtraction. Master these and your template will handle complex scenarios without custom macros.
Write formulas using cell references, not hardcoded numbers. Instead of typing "=5000-3000", write "=B5-B12" where B5 contains revenue and B12 contains expenses. This approach lets you change inputs without rewriting formulas. Use named ranges for frequently referenced cells to make formulas more readable.
Copy formulas across months using absolute and relative references correctly. If you write a formula in January that references a fixed annual budget number, lock that reference with dollar signs: =$B$5. If the formula should adjust for each month's data, use relative references: =B5. This distinction prevents errors when you drag formulas across columns.
SUM, AVERAGE, and Percentage Calculations for Income and Expenses
SUM adds up a range of cells. Use it for total income, total expenses, and subtotals within categories. The syntax is =SUM(B5:B12) where B5:B12 represents the range you want to add. Always check that your SUM range includes all relevant rows and doesn't accidentally capture blank cells or headers.
AVERAGE calculates the mean of a range. Use it to find average monthly revenue, average expense per category, or average gross margin. The syntax is =AVERAGE(B5:B12). This formula helps you spot outlier months and set realistic projections based on historical performance.
Percentage calculations show relationships between numbers. Calculate budget variance with =(Actual-Budget)/Budget. Calculate gross margin with =Gross_Profit/Revenue. Calculate expense ratio with =Total_Expenses/Total_Revenue. Format these cells as percentages to make them readable. A 15% variance is easier to interpret than 0.15.
IF Statements for Conditional Alerts and Budget Variance Tracking
IF statements add logic to your budget. The basic syntax is =IF(test, value_if_true, value_if_false). Use it to flag overspending: =IF(B5>C5,"Over Budget","On Track") where B5 is actual spending and C5 is budgeted amount. This formula returns text you can format with conditional formatting rules.
Combine IF with percentage thresholds for smarter alerts. =IF((B5-C5)/C5>0.1,"Review","OK") flags any category that's more than 10% over budget. Adjust the threshold based on your tolerance for variance. Some categories like marketing might allow 20% variance while payroll should stay within 2%.
Nest multiple IF statements to create tiered alerts. =IF(B5>C51.2,"Critical",IF(B5>C51.1,"Warning","OK")) creates three alert levels. This approach helps you prioritize which variances need immediate attention versus which ones are minor fluctuations.
VLOOKUP or XLOOKUP for Pulling Data from Multiple Sheets
VLOOKUP pulls data from a table based on a lookup value. Use it when you have a master list of categories on one sheet and want to pull budgeted amounts into your actuals sheet. The syntax is =VLOOKUP(lookup_value, table_array, col_index_num, FALSE). The FALSE argument ensures exact matches only.
XLOOKUP is the modern replacement for VLOOKUP, available in Excel 365 and Excel 2021. It's more flexible because it can look left or right and returns more intuitive results. The syntax is =XLOOKUP(lookup_value, lookup_array, return_array). Use it the same way as VLOOKUP but with simpler references.
These functions shine when you track multiple projects or departments. Create a master budget tab with all categories and amounts, then use VLOOKUP or XLOOKUP on individual project tabs to pull the relevant budget numbers. This setup lets you update the master budget once and see changes cascade everywhere.
Real-World Example: Customizing a Free Template for a Service Business
Take a marketing agency with three revenue streams: monthly retainers, project work, and training workshops. Start with a basic monthly budget template and add three income rows: "Retainer Revenue," "Project Revenue," and "Workshop Revenue." In January 2026, they project $15,000 from retainers, $8,000 from projects, and $3,000 from workshops for total revenue of $26,000.
The expense side includes fixed costs: $3,500 office rent, $1,200 software subscriptions, $800 insurance, and $2,500 for a part-time admin. Variable costs include $4,000 for contractor payments on client projects, $1,500 for paid ads, and $800 for miscellaneous expenses. Total expenses: $14,300. Net income projection: $11,700.
Add columns for actual results. In January, retainer revenue hit target at $15,000, but project revenue came in at $6,000 (25% under budget) because a client delayed their campaign launch. Workshop revenue exceeded expectations at $4,200 thanks to a last-minute corporate booking. Actual total revenue: $25,200, just 3% below budget.
On the expense side, contractor costs dropped to $3,000 because of the delayed project, but paid ads spiked to $2,200 due to an unplanned LinkedIn campaign. Total actual expenses: $14,000. Actual net income: $11,200, only $500 below projection despite the revenue shortfall.
The variance analysis shows the business stayed profitable even with a client delay. The budget template revealed that lower contractor costs partially offset the revenue miss. Without this visibility, the owner might have panicked about the project delay instead of recognizing the overall financial health remained strong.
Common Mistakes Small Business Owners Make with Excel Budgets
Most budget failures come from unrealistic assumptions, not technical errors. You set overly optimistic revenue projections, forget about irregular expenses, and never reconcile the budget against actual bank statements. These mistakes turn a useful tool into a fantasy document that doesn't guide real decisions.
Another common error is treating the budget as a one-time exercise instead of a living document. You spend a weekend building the perfect template, use it for two months, then abandon it when reality diverges from projections. Budgets only work when you update them monthly and adjust forecasts based on what you learn.
Technical mistakes like broken formulas and circular references frustrate users into giving up. Before you blame yourself for being "bad at Excel," check whether the template itself has errors. Download a different template and see if the problem persists. Sometimes the issue is the tool, not the user.
Mistake 1: Setting Unrealistic Revenue Projections
New business owners project revenue based on best-case scenarios instead of historical data. You assume every prospect will close, every client will renew, and seasonal slowdowns won't affect you. These projections set you up for disappointment and poor spending decisions.
Use conservative estimates when forecasting revenue. If you closed 40% of proposals last quarter, assume the same rate this quarter unless you've changed your sales process. If December is historically slow, don't project the same revenue as November. Build your budget around likely outcomes, not hopeful ones.
Create three forecast scenarios: conservative, expected, and optimistic. Use the conservative forecast for expense planning and hiring decisions. Use the expected forecast for monthly reviews. Use the optimistic forecast to model what you'd do with extra cash if everything goes right. This approach keeps you prepared for multiple outcomes.
Mistake 2: Forgetting Irregular Expenses Like Taxes and Insurance
Quarterly tax payments, annual insurance premiums, and software renewals hit your cash flow hard when you forget to budget for them. These expenses are predictable but infrequent, which makes them easy to overlook in a monthly budget structure.
Add a section for annual expenses and divide them by 12 to see the monthly impact. If you pay $6,000 in quarterly taxes, that's $2,000 per month you need to set aside. If annual insurance costs $3,600, budget $300 monthly. This approach prevents cash crunches when large bills come due.
Set up a separate savings account for irregular expenses and transfer the monthly amount automatically. When the tax bill or insurance renewal arrives, you've already accumulated the cash to pay it. This system works better than hoping you'll have enough in your operating account when the deadline hits.
Mistake 3: Not Reconciling the Budget Against Actual Bank Statements
Your budget shows what you planned to spend. Your bank statement shows what actually happened. If you never compare the two, you're flying blind. Reconciliation catches errors, reveals unauthorized charges, and shows where spending habits diverge from intentions.
Block time monthly to match every budget line item against bank and credit card transactions. If your budget shows $1,500 for software but your bank shows $1,800, investigate the difference. Did you forget a subscription? Did a vendor raise prices? Document the cause and adjust future projections.
Use bank transaction categories to speed up reconciliation. Most banks let you tag transactions with custom labels. Match these labels to your budget categories so you can export a report and compare it directly to your budget. This process takes 20 minutes instead of two hours.
Mistake 4: Using the Same Template Year After Year Without Updates
Your business changes, but your budget template stays frozen in time. You add new revenue streams, hire employees, expand into new markets, but keep using the same category structure from 2024. The template stops reflecting reality and becomes useless for decision-making.
Review your budget template structure every January. Add categories for new expense types, remove categories you no longer use, and adjust the dashboard to track metrics that matter now. If you hired your first employee, add payroll and benefits categories. If you shut down a product line, remove those revenue rows.
Archive old templates instead of overwriting them. Save each year's budget as a separate file so you can reference historical data without losing current structure. Name files clearly: "2025_Budget_Final.xlsx" and "2026_Budget_Working.xlsx". This practice preserves your financial history while letting you evolve the template.
When to Upgrade: Free Template vs. Premium Budget Tools
Free Excel templates work brilliantly until they don't. You'll know you've hit the limit when monthly updates take three hours instead of 30 minutes, when you need real-time data instead of manual entry, or when multiple team members need simultaneous access. These signals mean it's time to evaluate paid options.
Premium templates and dedicated software offer automation, bank integrations, multi-user collaboration, and built-in reporting that free templates can't match. They cost between $10 and $100 monthly depending on features and business size. The investment pays off when it saves you five hours of manual work each month.
Don't upgrade just because a tool looks impressive. Upgrade when the cost of your time spent on manual budget work exceeds the software subscription cost. If you bill at $150 per hour and spend four hours monthly on budget updates, a $50 tool that cuts that time in half saves you $300 in opportunity cost.
Signs You've Outgrown a Free Excel Budget Template
You spend more time fixing formulas than analyzing results. Broken cell references, circular dependencies, and manual copy-paste workflows consume hours each month. When troubleshooting the template becomes a job itself, you need a more robust solution.
Your business has multiple team members who need budget access. Excel files don't handle concurrent editing well, and version control becomes a nightmare. You end up with "Budget_Final_v3_Mike_Edits.xlsx" and no one knows which file contains current data.
You need real-time data instead of monthly updates. If you're checking your bank balance daily and making spending decisions based on current cash position, manual Excel updates lag too far behind reality. Bank-connected tools give you live data without manual entry.
What Premium Templates and Software Offer That Free Versions Don't
Bank integrations automatically import transactions and categorize them based on rules you set. You review and approve categorizations instead of
Get the newsletter
One sharp idea every Sunday.
No fluff. No sales pitches. Just the best of what we publish, hand-picked.
Continue Reading
Related Articles

10 Best Free Expense Tracker Spreadsheet Templates for 2026
Tracking every dollar you spend sounds simple until you open a blank spreadsheet and stare at empty cells. An expense tracker spreadsheet template gives you the structure, formulas, and categories alr...
10+ Free Cash Flow Forecast Excel Templates for 2026
Cash flow forecasting separates businesses that survive market swings from those that don't. A well-built Excel template gives you weekly visibility into when money arrives, when bills come due, and w...
10+ Free Monthly Budget Spreadsheet Templates for Excel (2026)
A monthly budget spreadsheet template for Excel is a pre-built file that organizes your income and expenses by category, showing exactly where your money goes each month without building formulas and...