9 Best OKR & KPI Dashboards for 2026: Track Goals Visually
Many businesses struggle with a fragmented view of performance. OKRs, or Objectives and Key Results, often live in one system, while Key Performance Indicators, KPIs, are tracked separately. This disc...
Why Combine OKRs and KPIs in One Dashboard?
The Challenge of Disconnected Goals and Metrics
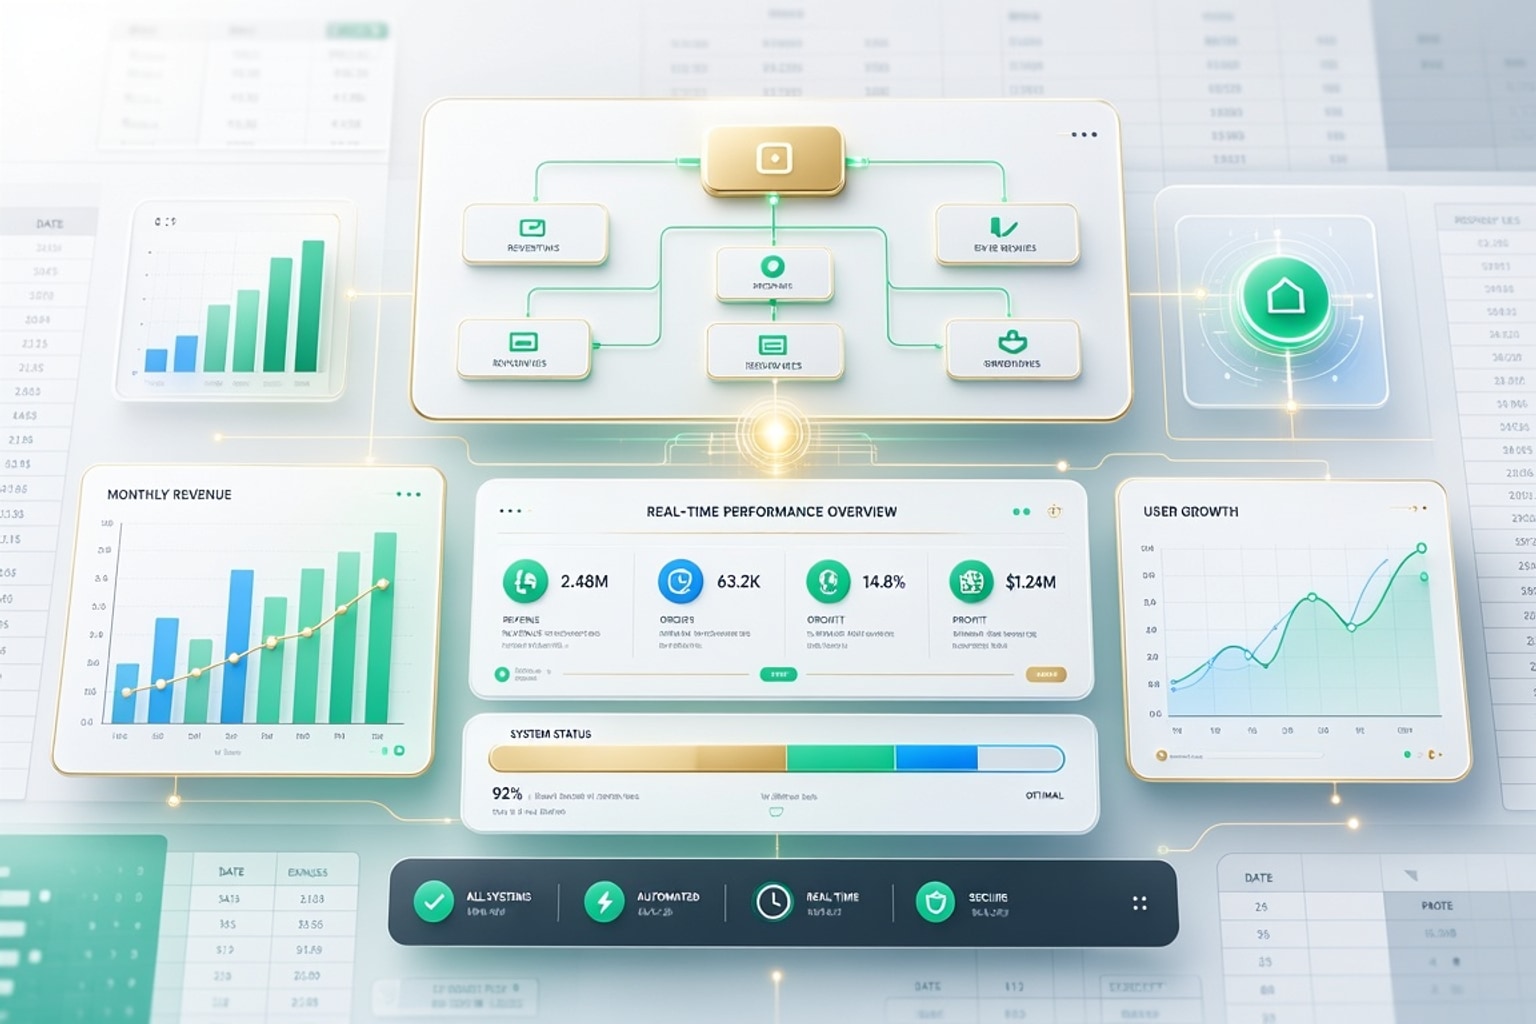
Many businesses struggle with a fragmented view of performance. OKRs, or Objectives and Key Results, often live in one system, while Key Performance Indicators, KPIs, are tracked separately. This disconnect makes it difficult to see how daily operations contribute to strategic goals. Teams become siloed, focusing on individual metrics without understanding their broader impact.
Without a unified dashboard, leaders spend excessive time manually compiling reports. They miss critical connections between operational performance and strategic progress. This leads to slower decision-making and a reactive rather than proactive approach to business growth.
The Power of Integrated Performance Tracking
Combining OKRs and KPIs into a single dashboard provides a holistic view of your business. You instantly see how operational metrics directly influence strategic objectives. This integrated approach fosters alignment across departments, ensuring everyone works towards common goals.
A unified dashboard simplifies reporting and highlights areas needing immediate attention. It transforms raw data into actionable insights, helping you make informed decisions faster. As one expert noted, "KPIs that don't change decisions are just decoration."
Building Your Integrated OKR and KPI Dashboard
Essential Components of a Unified Dashboard
A robust OKR and KPI dashboard needs several key features. Look for clear visualizations like progress bars, trend charts, and status indicators. The dashboard should display both your overarching objectives and the specific metrics driving them.
It must include real-time data updates, allowing for immediate insights into performance shifts. Customizable views are also crucial, letting different teams focus on their most relevant metrics. This ensures the dashboard remains a dynamic and useful tool for everyone.
Structuring Your Spreadsheet for Success
You can build an effective OKR and KPI dashboard using Google Sheets or Microsoft Excel. Start by creating separate tabs for your raw data, OKRs, and KPIs. A dedicated dashboard tab will then pull and visualize this information.
Column Structure for OKRs
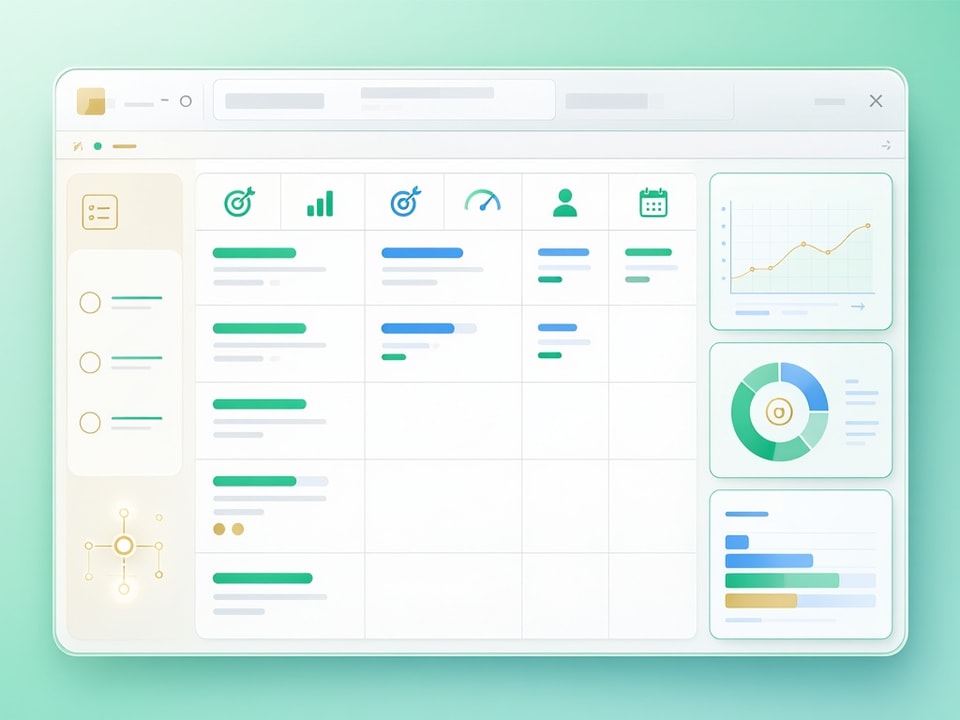
For your OKR tab, set up columns to capture essential information. Include "Objective" for the overarching goal, "Key Result" for the measurable outcome, "Target Value," and "Current Value." Add "Progress %" to track completion, "Owner" for accountability, and "Due Date."
You might also include a "Status" column, using conditional formatting to show "On Track," "At Risk," or "Behind." This visual cue provides quick insights into your OKR health.
Column Structure for KPIs
Your KPI tab should detail each Key Performance Indicator. Columns like "KPI Name," "Description," "Target Value," and "Current Value" are fundamental. Include "Trend" to show direction of movement, "Frequency" for how often it's measured, and "Owner."
Consider adding a "Threshold" column to define acceptable performance ranges. This allows for automated alerting when a KPI falls outside predefined limits.
Key Formulas for Progress Tracking
Formulas automate calculations and provide real-time updates. Use =(Current Value / Target Value) for "Progress %" on your OKR tab. For overall OKR status, an IF statement like =IF(D2/C2>=0.75,"On Track",IF(D2/C2>=0.5,"At Risk","Behind")) can categorize progress.
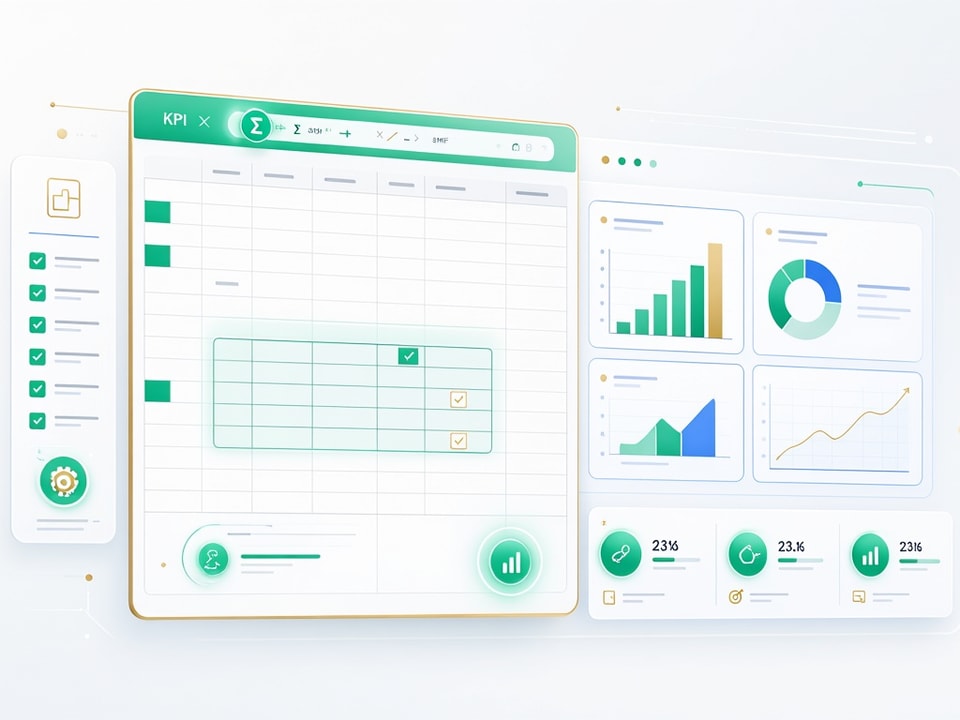
For KPIs, SPARKLINE formulas can create small, in-cell charts to visualize trends. You can also use AVERAGE or SUM formulas to aggregate data for dashboard views.
Choosing the Right Tool for Your Business
Dedicated OKR and KPI Software Solutions
Specialized software offers robust features beyond what spreadsheets provide. These platforms often include built-in reporting, integrations, and collaborative tools. They can significantly reduce manual setup and maintenance.
Perdoo: For Comprehensive Goal Management
Perdoo stands out for connecting OKRs and KPIs in one place, as noted by industry analysts. It offers comprehensive goal management, progress tracking, and strategic planning tools. Pricing for Perdoo starts from approximately $8 per user per month.
Weekdone: Streamlined Tracking for Teams
Weekdone combines OKRs with structured weekly planning, ensuring daily work aligns with strategic goals. "The weekly Plans, Progress, Problems reporting is a useful ritual that keeps OKRs connected to daily work," one user commented. Weekdone offers free trials, making it easy to test its team-focused features.
OKRs Tool: Budget-Friendly for Small Teams
OKRs Tool provides a cost-effective solution for smaller organizations. It offers a free tier for up to 5 users, making it accessible for startups or small departments. This platform focuses on straightforward OKR tracking and alignment.
Leveraging Spreadsheet Templates for Flexibility
For businesses preferring a hands-on approach or with specific customization needs, spreadsheet templates offer immense flexibility. They provide a pre-built structure, saving hours of initial setup time. You can tailor templates to your exact workflows and reporting requirements.
Recommended Resources
Start with the dashboard structure already built
These templates help you track goals and performance without building from scratch.
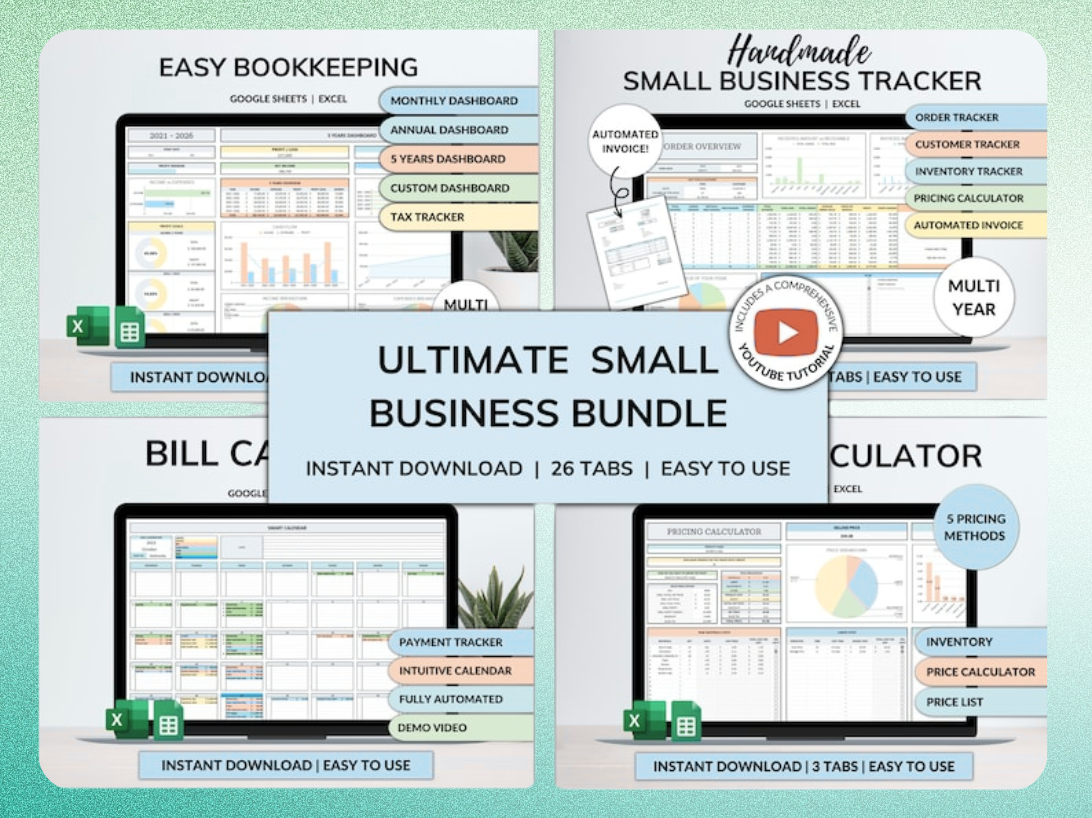
Ultimate Small Business Bundle Templates - Google Sheet + Ms Excel
All-in-One Spreadsheets for Bookkeeping, Inventory, Orders, Billing & Pricing Save Hours Every Week: Automate data entry and dashboards so you can focus on growth, not spreadsheets.
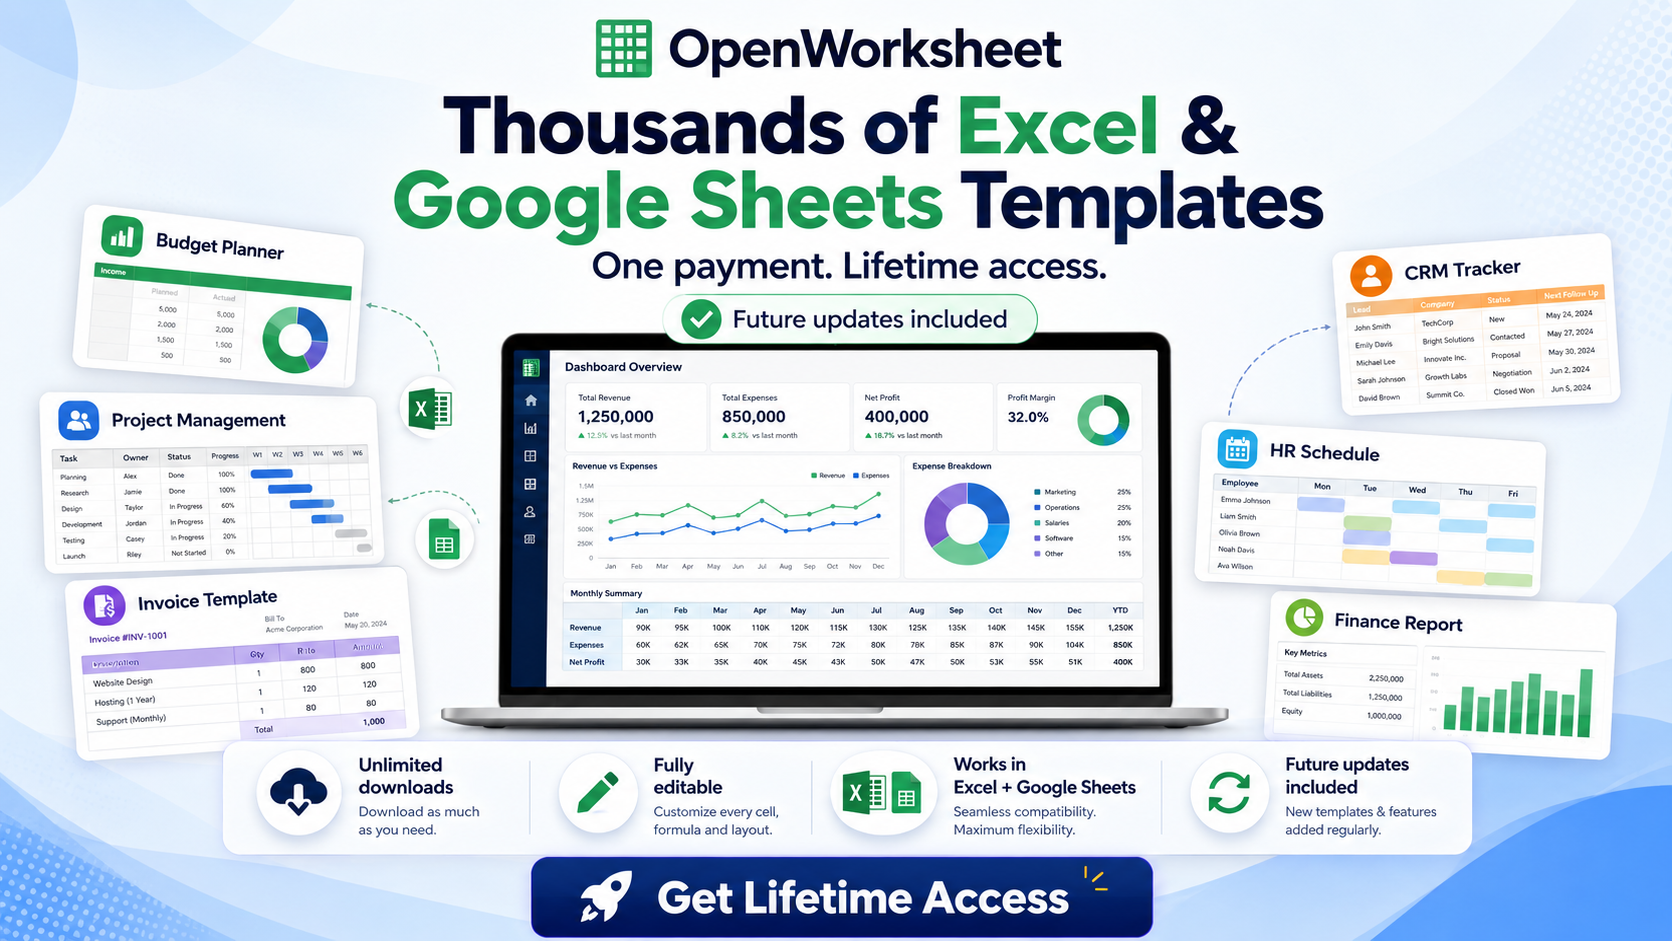
Thousands of Spreadsheet Templates Mega Library – Google Sheet Supported
The Openworksheet Mega Library: A Starting Point
The Thousands of Spreadsheet Templates Mega Library offers a vast collection of Google Sheets and Excel templates. You can find pre-designed dashboards for various business functions, including goal tracking. This library provides a solid foundation for building your integrated OKR and KPI dashboard.
Small Business Bundle: All-in-One Tracking
The Ultimate Small Business Bundle Templates provides an all-in-one spreadsheet solution. It includes templates for bookkeeping, inventory, and orders, alongside performance tracking. This bundle is ideal for small business owners, freelancers, and managers looking to automate data entry and dashboards.
Practical Implementation: From Strategy to Dashboard
Defining Clear OKRs and Measurable KPIs
Start by clearly defining your strategic objectives. Each Objective should have 3-5 measurable Key Results that indicate progress. For KPIs, ensure they are specific, measurable, achievable, relevant, and time-bound, SMART. Avoid vague goals that are hard to track.
Involve your team in the goal-setting process. This fosters ownership and ensures everyone understands how their work contributes to overall success.
Setting Up Automated Data Flows
Reduce manual data entry by automating data flows wherever possible. Connect your dashboard to existing data sources like CRM systems, marketing platforms, or financial software. Tools like Zapier or Google Apps Script can facilitate these integrations.
Automated data ensures your dashboard always reflects current performance. This frees up time for analysis rather than data collection.
Regular Review and Adaptation
An effective dashboard is a living document, not a static report. Schedule regular review meetings to discuss progress, identify roadblocks, and make necessary adjustments. OKRs are typically reviewed quarterly, while KPIs might be monitored weekly or monthly.
Be prepared to adapt your OKRs and KPIs as business priorities evolve. The goal is continuous improvement, not rigid adherence to outdated metrics.
Common Mistakes to Avoid
Over-Complicating Your Dashboard
Resist the urge to include too many metrics or complex visualizations. An overloaded dashboard becomes difficult to read and loses its effectiveness. Focus on the most critical OKRs and KPIs that truly drive decision-making.
Keep the design clean and intuitive. The dashboard should provide insights at a glance, not require extensive interpretation.
Neglecting Regular Updates
A dashboard is only valuable if its data is current. Neglecting regular updates renders your performance insights meaningless. Implement a clear process for data input and review, whether manual or automated.
Consistent updates ensure your team always has an accurate picture of progress. This supports timely interventions and strategic pivots.
Focusing on Too Many Metrics
Avoid the trap of tracking everything. Prioritize a manageable number of OKRs and KPIs that align with your strategic goals. Too many metrics dilute focus and can lead to analysis paralysis.
Choose metrics that are actionable and directly inform your business decisions. Less is often more when it comes to effective performance tracking.
Get the newsletter
One sharp idea every Sunday.
No fluff. No sales pitches. Just the best of what we publish, hand-picked.
Continue Reading
Related Articles
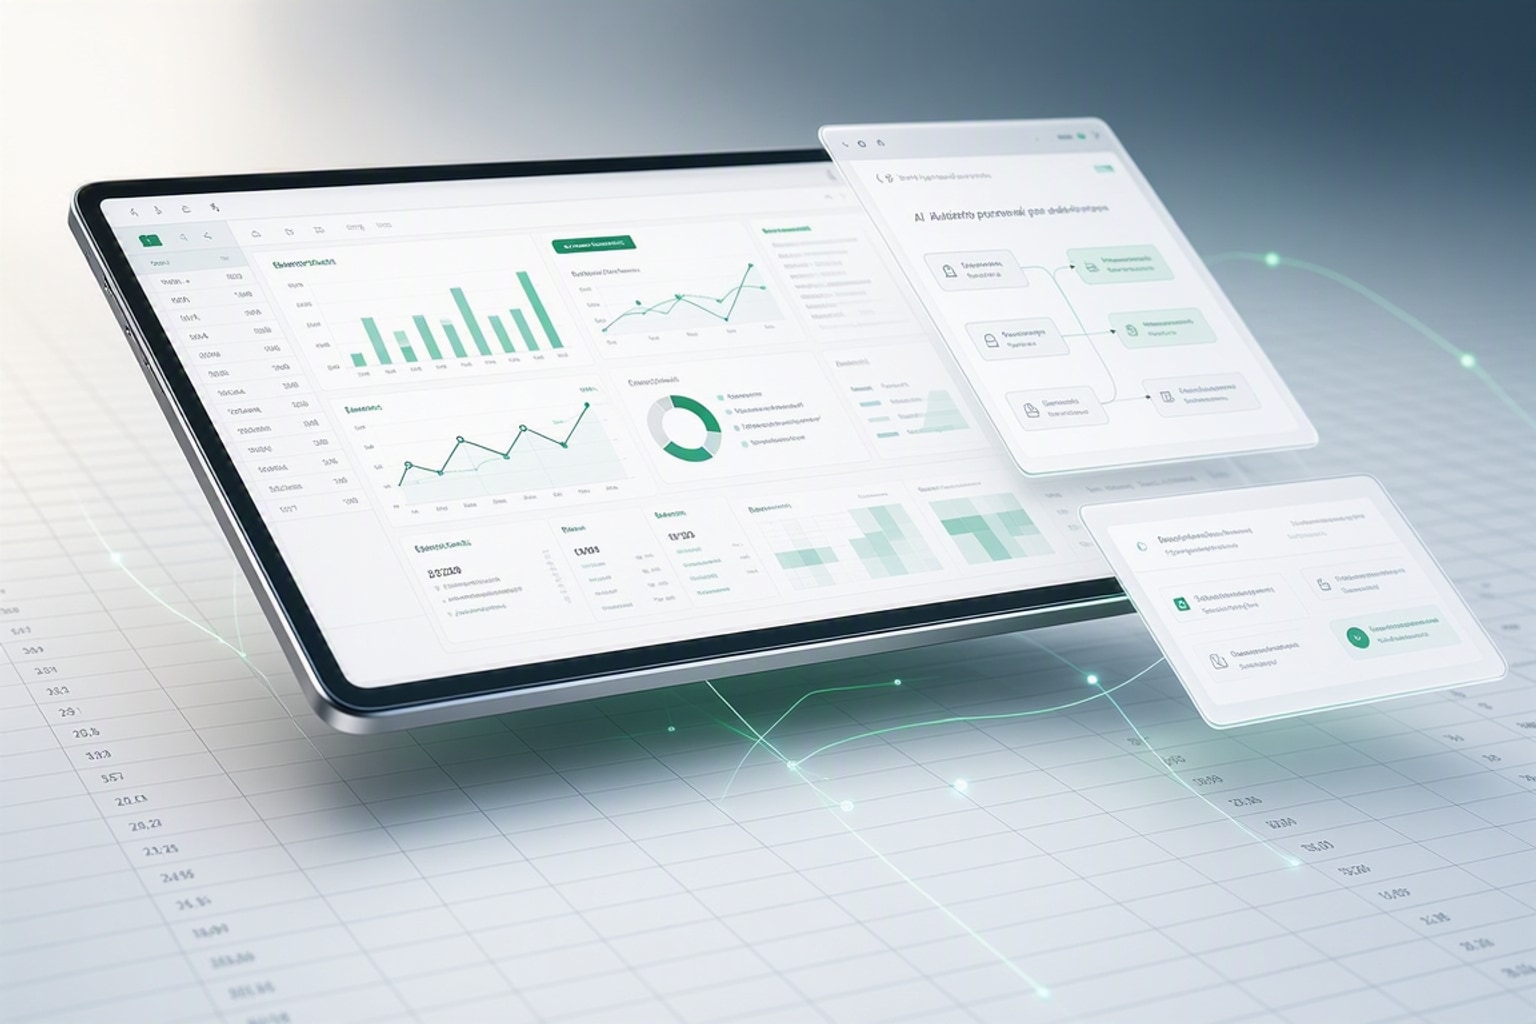
Best Business Dashboards in Excel (2026 Guide)
Business dashboards in Excel turn raw numbers into decisions. A dashboard is a visual representation of key metrics that allows you to quickly view and analyze your data in one place. In 2026, Excel's...
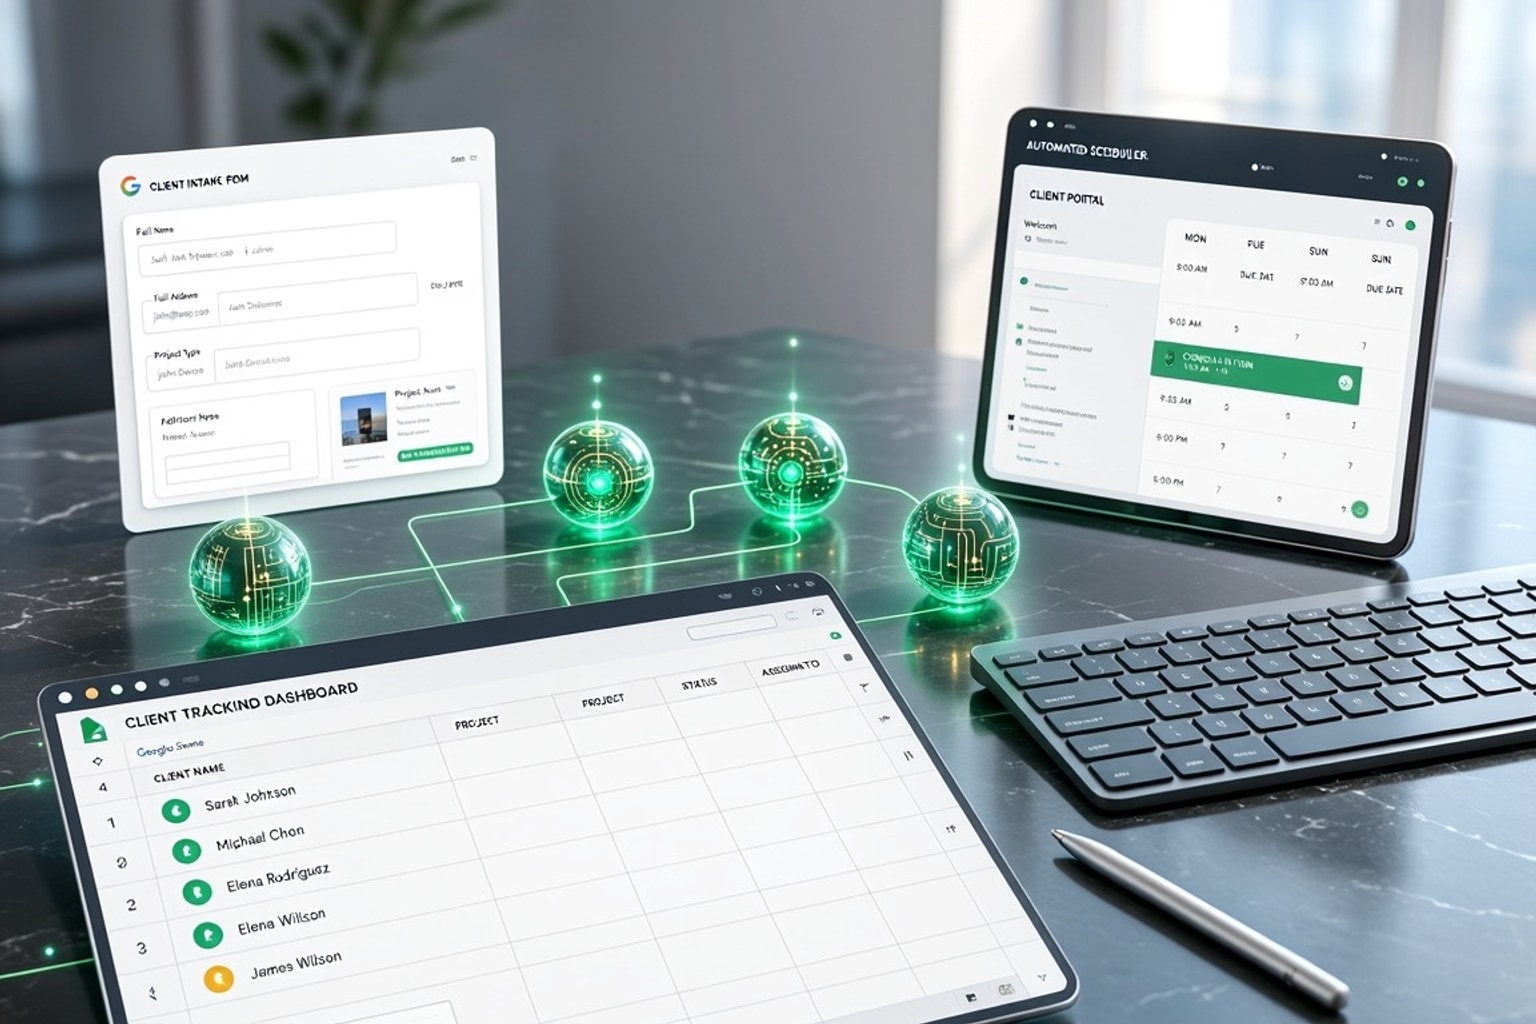
Automate Freelance Onboarding: 7 Google Sheets Strategies
Freelancers often juggle client work, marketing, and administrative tasks. Manual client onboarding adds unnecessary friction, turning what should be an exciting start into a tedious chore. This ineff...
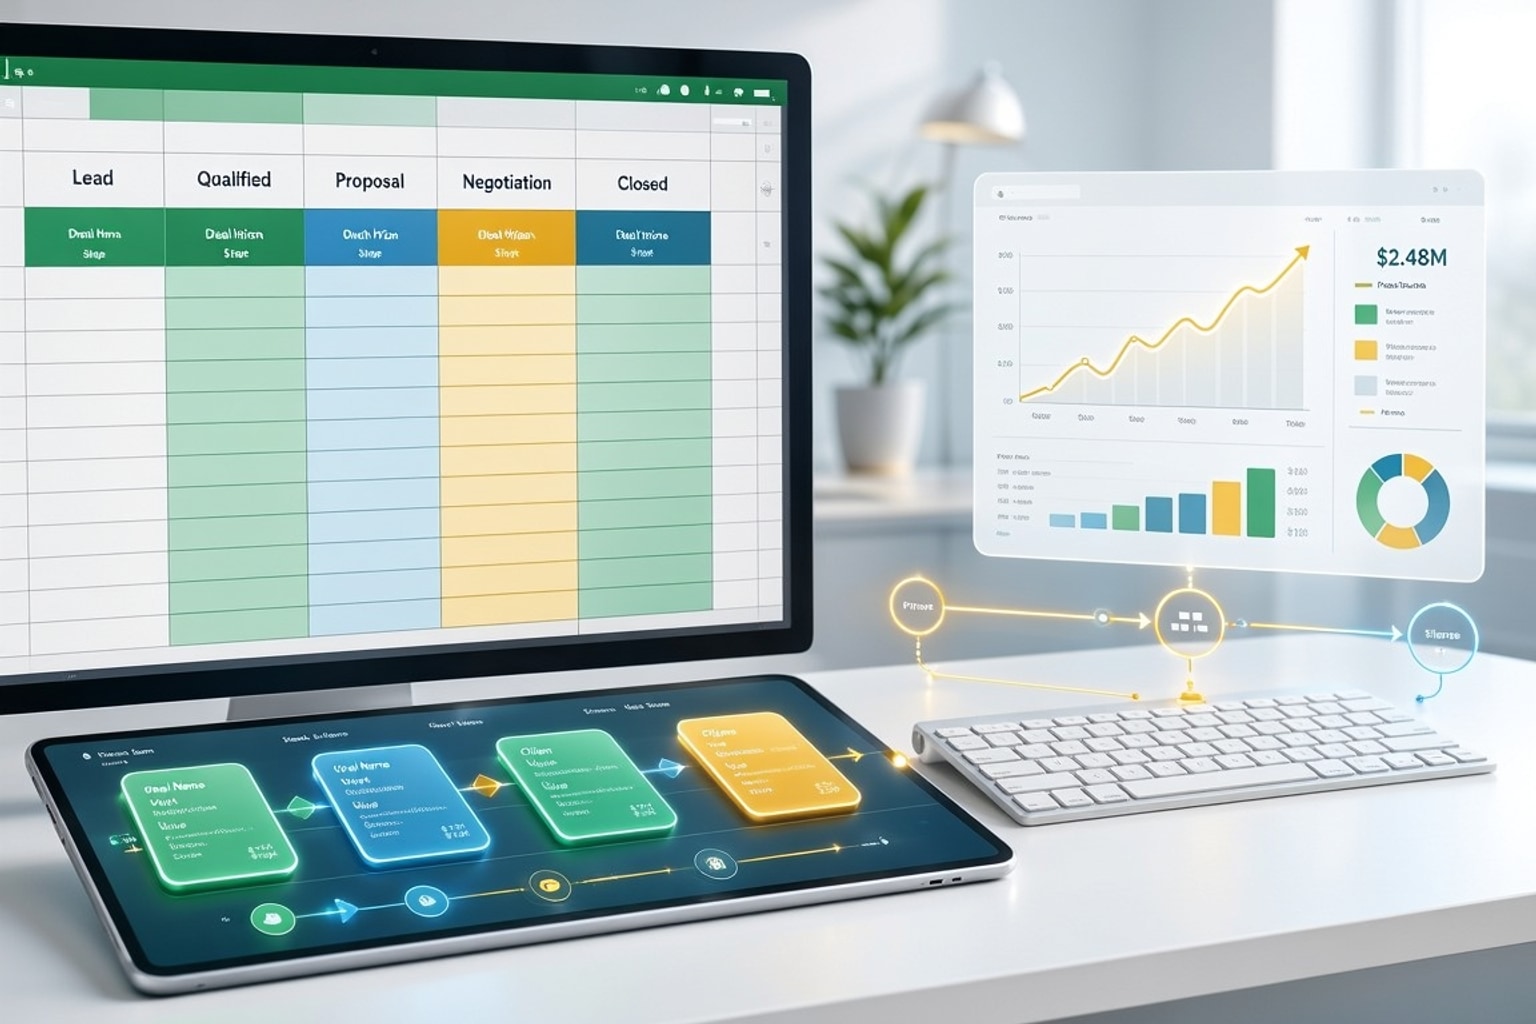
Build a High-Converting Sales Pipeline Tracker in Excel: 7 Steps
A disorganized sales pipeline costs more than just lost deals. It leads directly to missed revenue opportunities and frustrated sales teams. Without a clear view of your prospects, forecasting becomes...