Build a High-Converting Sales Pipeline Tracker in Excel: 7 Steps
A disorganized sales pipeline costs more than just lost deals. It leads directly to missed revenue opportunities and frustrated sales teams. Without a clear view of your prospects, forecasting becomes...
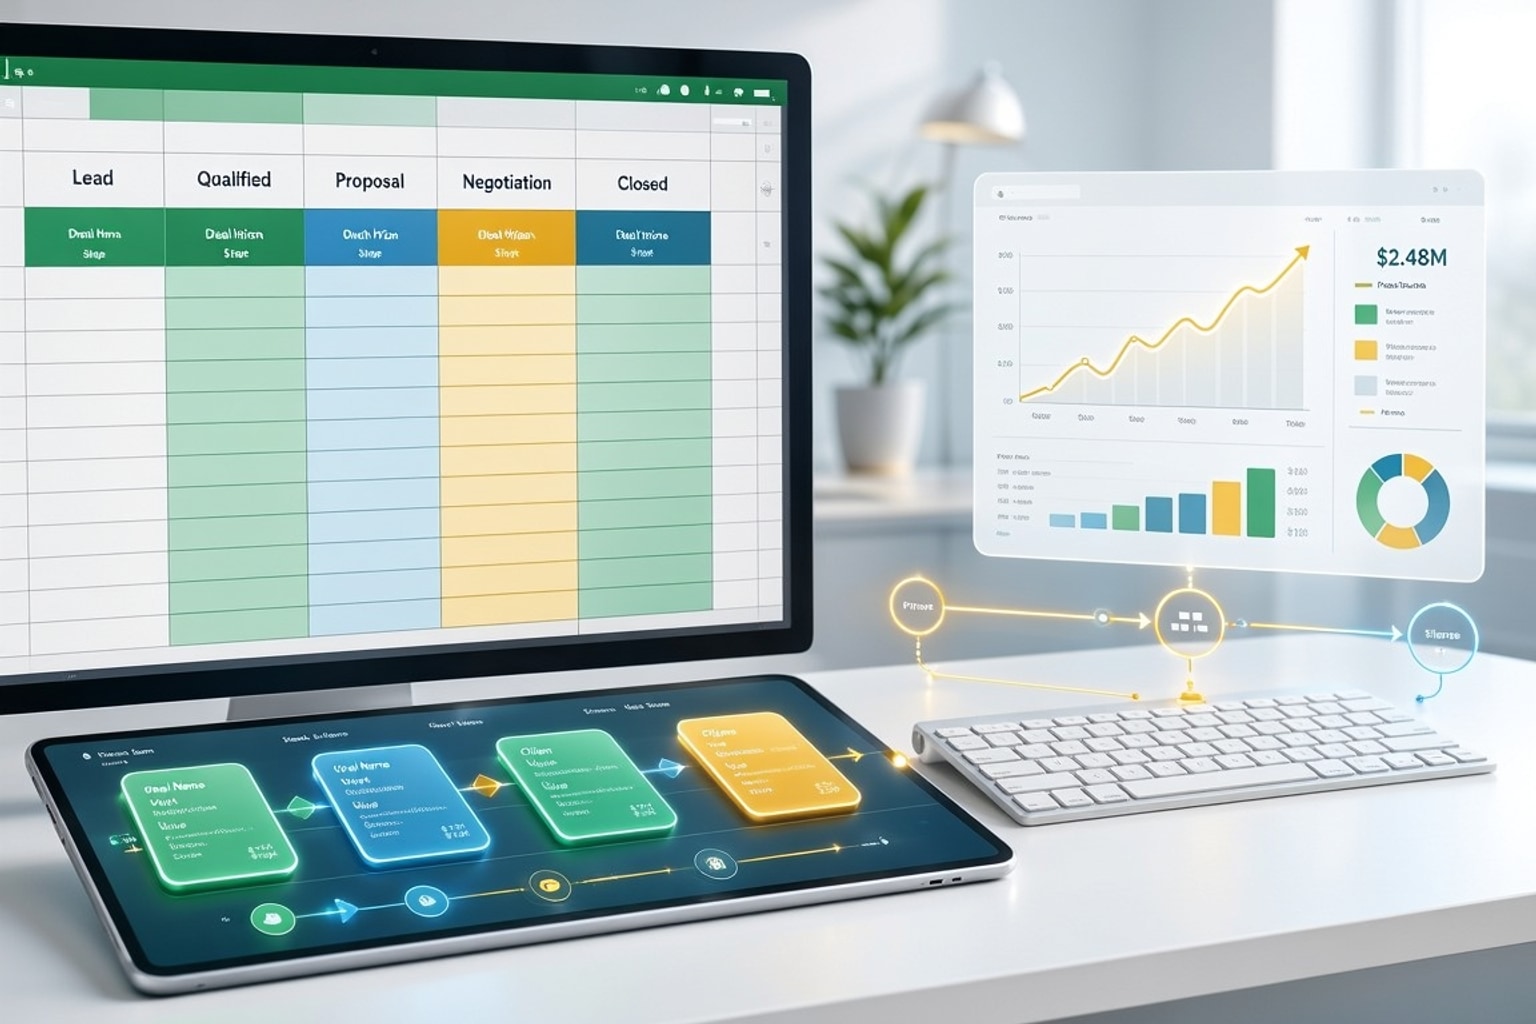
A disorganized sales pipeline costs more than just lost deals. It leads directly to missed revenue opportunities and frustrated sales teams. Without a clear view of your prospects, forecasting becomes guesswork, and strategic decisions lack data.
The Cost of a Poorly Managed Pipeline
Inefficient sales tracking hits your bottom line hard. Businesses adopting weighted forecasting, for example, report a 25% improvement in sales projection accuracy. Conversely, 63% of sales managers admit their organization poorly manages its pipeline, leading to significant financial and operational drag.
Moving Beyond Basic Lead Tracking
Simply listing leads isn't enough anymore. Effective pipeline management demands a strategic, data-driven approach. Your sales pipeline is the most important predictor of future revenue. It's a powerful tool for growth when managed correctly.
Designing Your High-Converting Sales Pipeline Tracker in Excel
Building an effective sales pipeline tracker in Excel means structuring your data to provide clear insights. You need to capture the right information and present it in an actionable way. This transforms a simple spreadsheet into a powerful sales management tool.
Defining Your Sales Stages for Clarity and Conversion
Start by defining clear, actionable sales stages that mirror your actual sales process. Common stages include Prospecting, Qualification, Proposal, Negotiation, and Closed Won/Lost. Each stage should have specific criteria for entry and exit.
Essential Data Points for Every Deal
For each opportunity, track critical information. This includes a unique Deal ID, Client Name, the current Stage, Deal Value, Expected Close Date, and Probability of Close. These data points form the backbone of your analysis and forecasting.
Step-by-Step: Building Your Excel Sales Pipeline Tracker
Let's build out the core structure of your tracker. This involves setting up your main data table and then enriching it with formulas and visual cues.
Setting Up Your Core Data Table
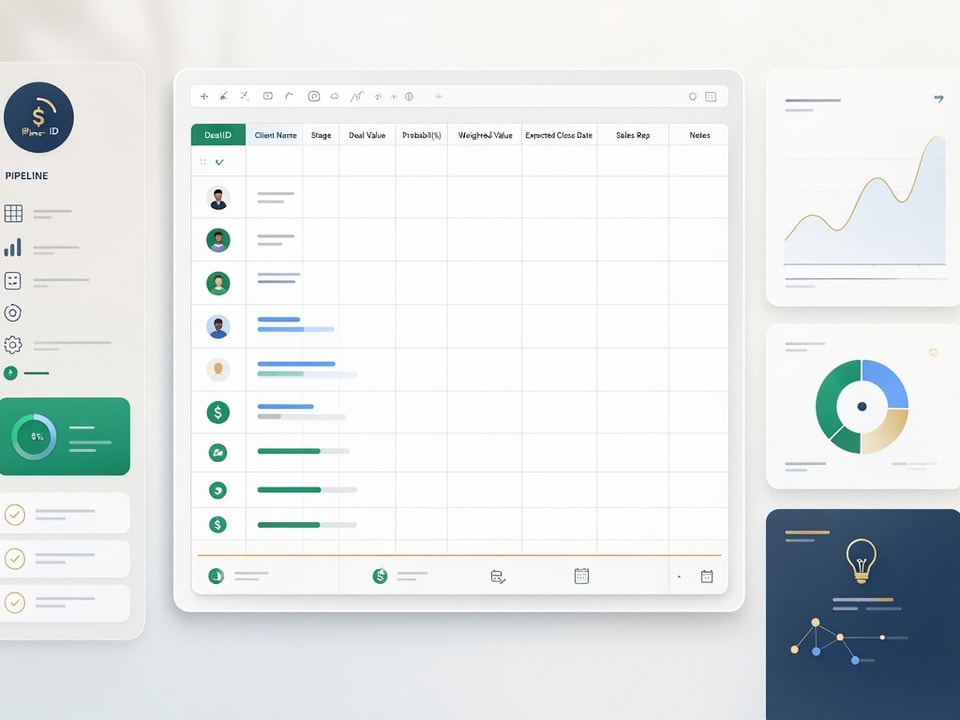
Open a new Excel workbook. In the first row, create the following headers: Deal ID, Client Name, Product/Service, Stage, Deal Value, Probability (%), Weighted Value, Expected Close Date, Sales Rep, Notes. Populate a few rows with sample data to see how it looks.
Implementing Key Formulas for Forecasting and Analysis
The Weighted Value column is crucial for forecasting. In cell G2 (assuming your headers are in row 1), enter the formula =E2*F2. This multiplies the Deal Value by the Probability (%) to give you a more realistic forecast. Drag this formula down for all deals. Businesses using weighted forecasting see a 25% improvement in sales projection accuracy.
Visualizing Progress with Conditional Formatting
Conditional formatting highlights critical information at a glance. Select the Stage column, go to Home > Conditional Formatting > Highlight Cells Rules > Text That Contains. Set rules to color code stages, for example, "Proposal" in yellow and "Negotiation" in orange. You can also use it to highlight overdue close dates.
Recommended Resources
Skip the blank-sheet setup
Use a cleaner template before you customize.
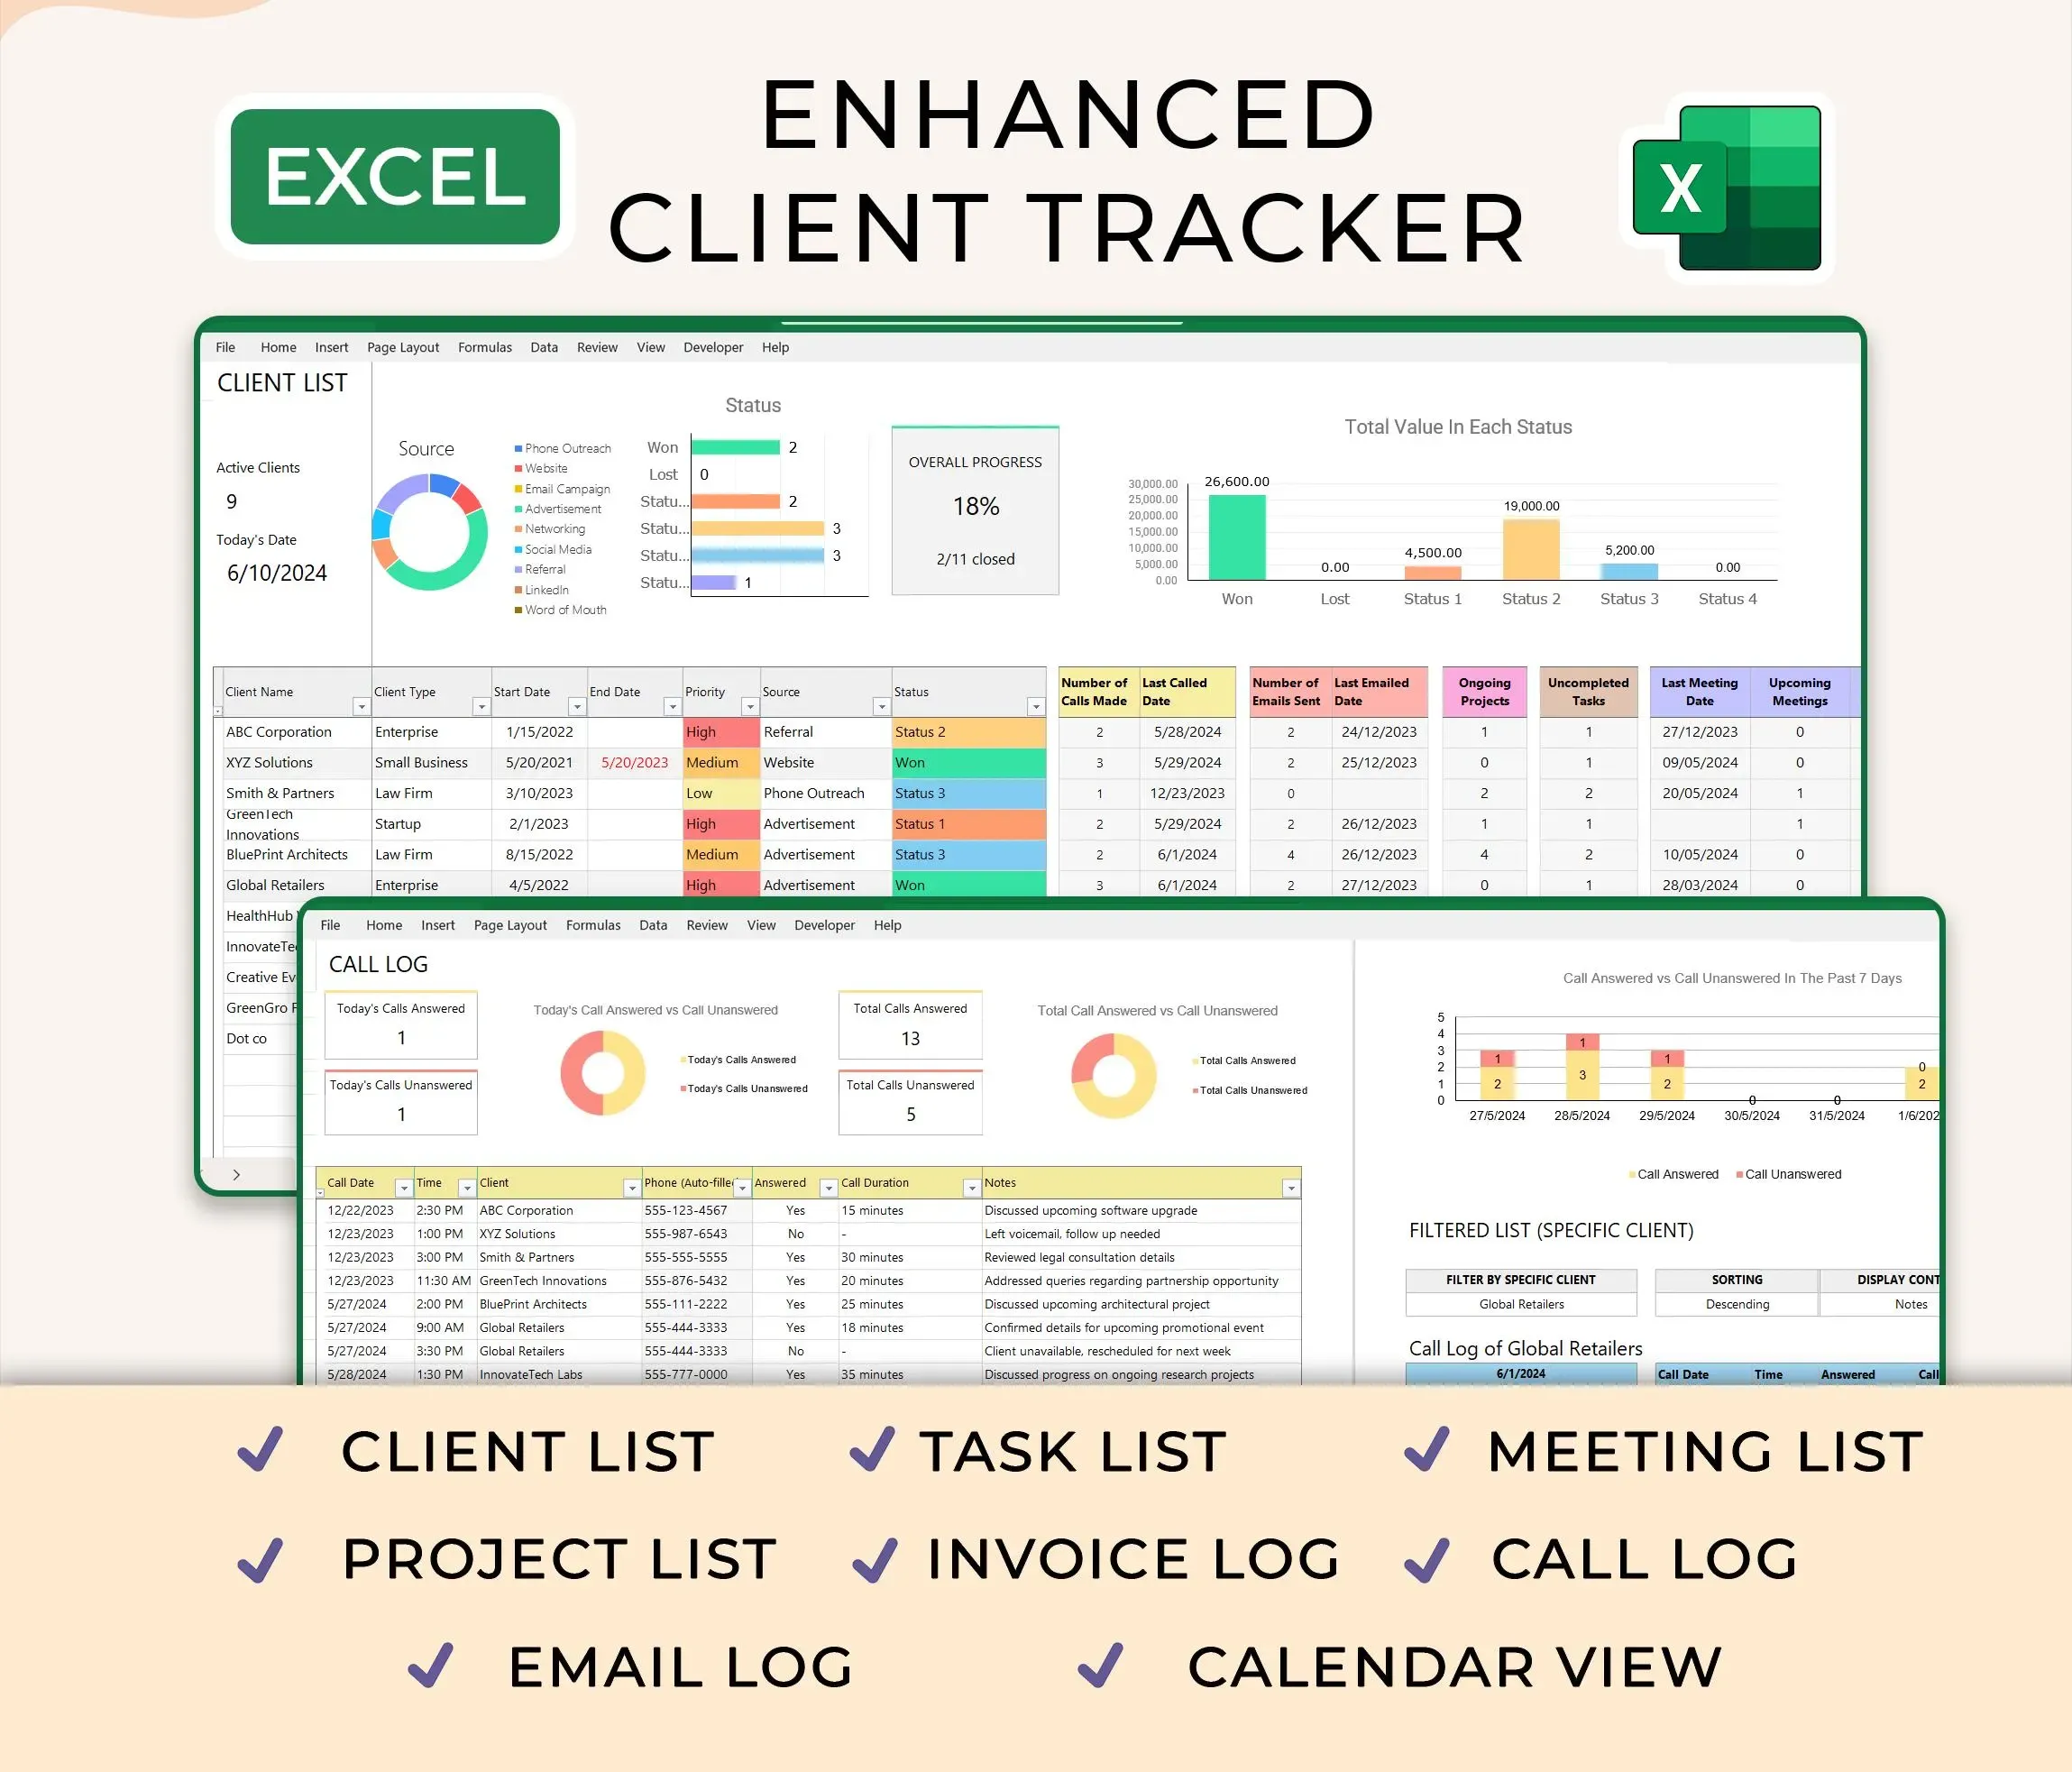
Ultimate Client Tracker CRM Template – Google Sheet & Ms Excel Versions
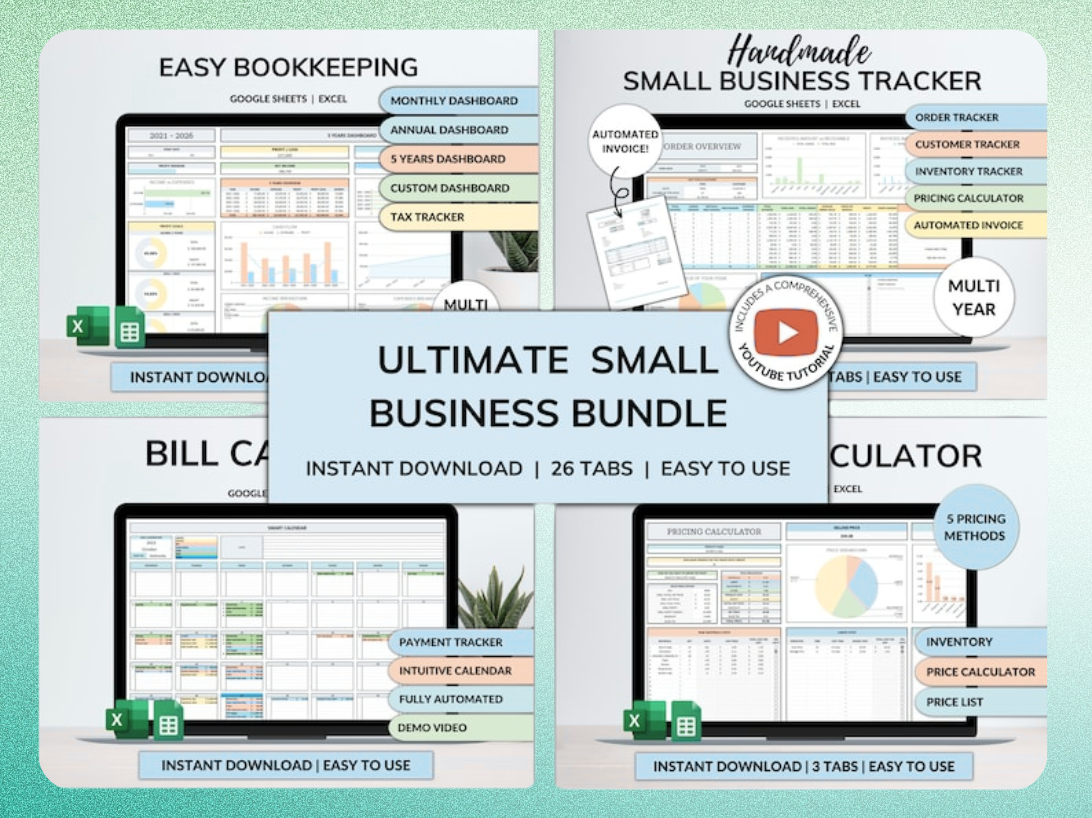
Ultimate Small Business Bundle Templates - Google Sheet + Ms Excel
All-in-One Spreadsheets for Bookkeeping, Inventory, Orders, Billing & Pricing Save Hours Every Week: Automate data entry and dashboards so you can focus on growth, not spreadsheets.
Key Metrics and Reports for Sales Performance
Your tracker becomes powerful when you extract insights from the data. These insights help you understand what's working and what needs improvement.
Tracking Conversion Rates Between Stages
To track conversion rates, count the number of deals moving from one stage to the next. For instance, if 100 deals enter "Qualification" and 50 move to "Proposal," your conversion rate is 50%. A low conversion rate, like only 20% of proposals converting, signals a significant bottleneck.
Identifying Bottlenecks and Opportunities
Analyze your stage conversion rates. If many deals get stuck in "Negotiation," it suggests a problem with your negotiation strategy or pricing. This data helps you pinpoint where deals are stalling and where to focus training or process improvements.
Generating Simple Pipeline Reports and Dashboards
Use Excel's built-in charting tools to visualize your pipeline. A simple bar chart showing the number of deals in each stage gives an instant overview. A well-structured pipeline report shifts teams from reactive scrambling to proactive planning.
Maximizing Your Tracker: Tips, Templates, and Automation
Enhance your Excel tracker's utility and save significant time. Don't reinvent the wheel if a ready-made solution fits your needs.
When to Use a Pre-Built Sales Pipeline Template
Starting with a pre-built template like the Ultimate Client Tracker CRM Template can drastically reduce setup time. These templates often include pre-configured stages, formulas, and dashboards based on best practices. They provide a solid foundation, allowing you to focus on selling, not spreadsheet design.
Customizing Templates for Your Unique Sales Process
Even with a template, customize it to fit your specific business needs. Adjust stage names, add custom fields relevant to your industry, or modify formulas to reflect your unique sales cycle. The goal is to make the tracker a perfect fit for your team.
Exploring Automation for Data Entry and Reporting
Consider using simple automations to reduce manual effort. For example, integrate your tracker with other tools using Excel's Power Query or basic VBA scripts. For broader business needs, bundles like the Ultimate Small Business Bundle Templates offer integrated solutions that can streamline various operational tasks beyond sales.
Excel vs. CRM: When to Upgrade Your Sales Tracking
Excel is a powerful tool, but it has limits. Understand when to stick with it and when to consider a dedicated CRM.
The Advantages of Excel for Small Teams and Startups
Excel's accessibility and zero cost are primary advantages for many businesses. It offers immense flexibility for customization without needing development resources. For small teams, it's an ideal starting point for managing a sales pipeline effectively.
Recognizing Excel's Limitations for Scalability
As your team grows, Excel presents challenges. Collaboration becomes difficult, version control issues arise, and advanced reporting can be cumbersome. Data integrity can suffer with multiple users. These limitations often signal a need for a more robust solution.
Making the Transition to a Dedicated CRM
When collaboration, advanced analytics, and integration with other business systems become critical, it's time to consider a dedicated CRM. CRMs offer specialized features for sales automation, comprehensive reporting, and better data security. Transitioning helps maintain scalability and efficiency as your business expands.
Get the newsletter
One sharp idea every Sunday.
No fluff. No sales pitches. Just the best of what we publish, hand-picked.
Continue Reading
Related Articles
10+ Ultimate Small Business Bookkeeping Templates for Excel 2026
Small businesses thrive on clear financial visibility. Without a dedicated bookkeeping system, you're navigating blind, making decisions based on guesswork instead of data. In 2026, robust financial t...
10+ Free Employee Attendance Tracker Excel Templates (2026)
Efficient attendance tracking saves businesses money and ensures compliance. Manual systems, prone to errors, cost companies thousands annually. A robust Excel tracker provides accurate data for payro...
10+ Free Sales Tracker Excel Templates for 2026 Growth
Every business, regardless of size, needs a clear view of its sales performance. A sales tracker provides that clarity. It moves you beyond guesswork, offering concrete data to understand what's worki...