Excel vs. Sheets: Your break-even point template choice
Learn how to choose the best break even analysis spreadsheet template between Excel and Sheets for your business needs.
The most common mistake in a break-even analysis spreadsheet template is conflating fixed and variable costs, often by misclassifying essential operational expenses. This error usually stems from not fully understanding that fixed costs remain constant regardless of production volume, while variable costs fluctuate directly with each unit produced or sold. Without accurate cost segregation, your break-even point calculation will be misleading, painting an inaccurate picture of when your business will actually become profitable.
To get a clear understanding of your business's financial viability, you need a reliable break-even analysis spreadsheet template. This involves meticulously categorizing all your expenses and revenue streams. A well-constructed template will help you pinpoint the exact sales volume or revenue needed to cover all costs, allowing for more informed strategic decisions.
Defining Your Costs: Fixed vs. Variable
Accurate cost categorization is the bedrock of any break-even calculation.
Fixed Costs: These are expenses that do not change with the level of output or sales. Think of them as the baseline cost of keeping your business operational. Examples include:
- Rent for your office or retail space.
- Salaries for administrative staff (not directly tied to production).
- Insurance premiums.
- Loan payments.
- Software subscriptions (e.g., accounting software, CRM).
- Depreciation of long-term assets.
Variable Costs: These costs increase or decrease directly in proportion to the volume of goods or services produced or sold. If you sell more units, your variable costs go up. Examples include:
- Raw materials used in production.
- Direct labor involved in manufacturing or service delivery.
- Packaging costs.
- Sales commissions.
- Shipping costs per unit.
- Payment processing fees per transaction.
A common pitfall is classifying a semi-variable cost incorrectly. For instance, a utility bill might have a fixed base charge plus a usage-based component. For a break-even analysis, you'd need to separate these or allocate the variable portion based on production estimates.
Calculating Your Break-Even Point
The break-even point (BEP) is the level of sales at which total revenues equal total costs. There are two primary ways to express it: in units or in revenue.
1. Break-Even Point in Units: This tells you how many units you need to sell to cover all your costs.
- Formula: Fixed Costs / (Selling Price Per Unit, Variable Cost Per Unit)
2. Break-Even Point in Revenue: This tells you the total revenue you need to generate to cover all your costs.
- Formula: Fixed Costs / Contribution Margin Ratio
- Contribution Margin Ratio: (Selling Price Per Unit, Variable Cost Per Unit) / Selling Price Per Unit
Let's use a hypothetical example to illustrate. Suppose your business, "Artisan Widgets," has the following:
- Total Fixed Costs: $10,000 per month
- Selling Price Per Unit: $50
- Variable Cost Per Unit: $20
Break-Even Point in Units: $10,000 / ($50 - $20) = $10,000 / $30 = 333.33 units
Since you can't sell a fraction of a widget, you'd need to sell 334 units to officially break even and start making a profit.
Break-Even Point in Revenue: First, calculate the contribution margin ratio: ($50 - $20) / $50 = $30 / $50 = 0.60 or 60%
Now, calculate the break-even point in revenue: $10,000 / 0.60 = $16,666.67
This means Artisan Widgets needs to generate $16,666.67 in sales revenue to cover all its costs.
Building Your Own Break-Even Analysis Spreadsheet
You can build a functional break-even analysis spreadsheet template in Excel or Google Sheets from scratch. Here’s a basic structure:
Sheet 1: Data Input
This sheet will contain all your raw numbers.
- Column A: Cost/Revenue Item (e.g., Rent, Raw Materials, Widget Price)
- Column B: Category (Fixed, Variable, Revenue)
- Column C: Amount (The numerical value for each item)
Sheet 2: Calculations
This sheet pulls data from Sheet 1 and performs the break-even calculations.
- Cell A1: Label: "Total Fixed Costs"
- Formula in B1:
=SUMIF(Data!B:B,"Fixed",Data!C:C)(This sums all amounts categorized as "Fixed" on the Data sheet) - Cell A2: Label: "Total Variable Costs Per Unit"
- Formula in B2:
=SUMIF(Data!B:B,"Variable",Data!C:C)(This sums all amounts categorized as "Variable" on the Data sheet) - Cell A3: Label: "Selling Price Per Unit"
- Formula in B3:
=VLOOKUP("Selling Price Per Unit",Data!A:C,3,FALSE)(Assumes "Selling Price Per Unit" is listed in Column A on Data sheet) - Cell A4: Label: "Contribution Margin Per Unit"
- Formula in B4:
=B3-B2 - Cell A5: Label: "Contribution Margin Ratio"
- Formula in B5:
=IF(B3<>0,B4/B3,0)(Handles potential division by zero if selling price is $0) - Cell A6: Label: "Break-Even Point (Units)"
- Formula in B6:
=IF(B4>0,B1/B4,0)(Handles potential division by zero if contribution margin is $0) - Cell A7: Label: "Break-Even Point (Revenue)"
- Formula in B7:
=IF(B5>0,B1/B5,0)(Handles potential division by zero if contribution margin ratio is $0)
This structure provides a clear, dynamic break-even analysis spreadsheet template that updates automatically as you change your input data.
Leveraging Pre-built Templates
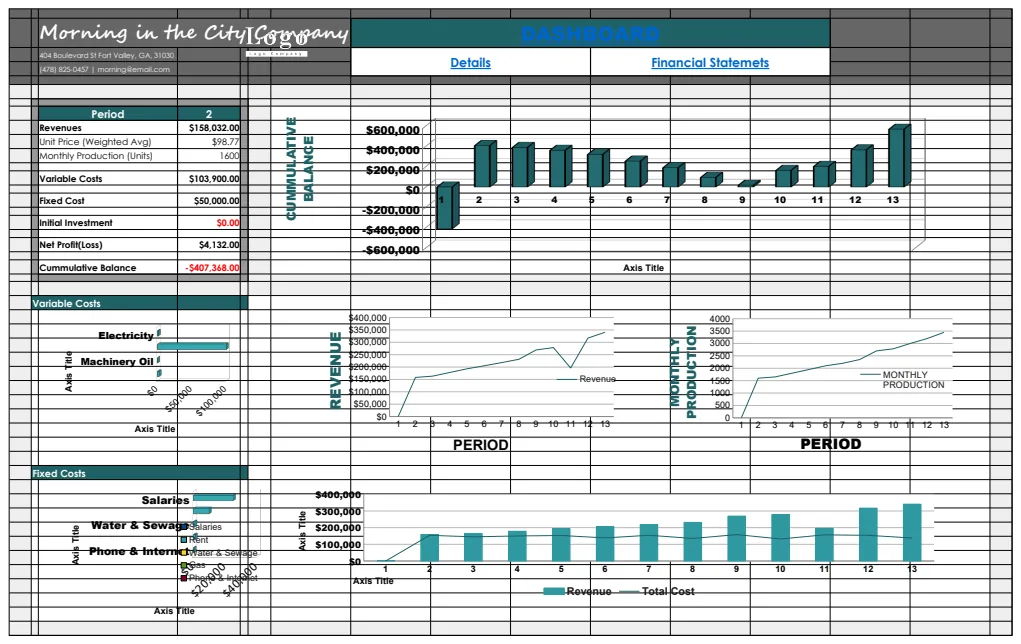
While building your own is educational, sometimes you need a ready-made solution. There are excellent options available that save significant setup time. For instance, a comprehensive tool like the Break Even Analysis template can provide not only the core calculations but also visual charts to illustrate your break-even point.
These templates are designed with best practices in mind, often including error checking and scenario planning features. If you're dealing with IT-specific costs, the IT Financial Break-Even Analysis template offers tailored fields for technology-related expenses and revenues.
Common Mistakes and Pitfalls
Beyond miscategorizing costs, several other errors can derail your break-even analysis:
- Ignoring Time Frame: Break-even calculations are time-sensitive. Ensure your fixed costs are aligned with a specific period (e.g., monthly, annually) and that your sales targets reflect this period.
- Using Gross Profit Instead of Contribution Margin: The break-even formula specifically requires the contribution margin (selling price minus variable costs), not gross profit (revenue minus cost of goods sold, which may include some fixed overhead).
- Not Updating Data: Assumptions change. Your raw material costs might increase, or you might adjust your pricing. Failing to revisit and update your break-even analysis regularly renders it obsolete.
- Overly Simplistic Variable Costing: For complex products with multiple components or outsourced services, ensure all direct variable costs are accounted for. A missing piece here can significantly skew the BEP.
- Forgetting Capacity Constraints: A break-even analysis tells you when you can be profitable, but it doesn't tell you if you can physically produce that many units or serve that many clients. It’s important to consider production or service capacity alongside the financial break-even point.
Enhancing Your Analysis with Scenarios
A static break-even point is useful, but real business involves variables. You can enhance your break-even analysis spreadsheet template by building in scenario planning.
For example, create sections for "Best Case," "Worst Case," and "Most Likely" scenarios. In each scenario, you might adjust:
- Selling Price: What if you offer a discount? What if you can command a premium?
- Variable Costs: What if material prices surge? What if you find a cheaper supplier?
- Fixed Costs: What if you need to rent additional space? What if you hire more staff?
This approach allows you to see how your break-even point shifts under different conditions, providing a more robust understanding of your business's resilience and potential risks. A template like Break Even Analysis Template often provides a good framework for this type of analysis.
What if my costs are not linear?
If your costs behave in a non-linear fashion (e.g., stepped fixed costs where you need to rent a second facility after reaching a certain output, or economies of scale that significantly reduce variable costs per unit beyond a threshold), a simple break-even formula won't suffice. You'll need to segment your analysis. For instance, calculate the break-even point for the first facility, then calculate the break-even point for the second facility, accounting for the new fixed costs and potentially altered variable costs.
How often should I update my break-even analysis?
The frequency of updates depends on the volatility of your business environment. For businesses with stable costs and pricing, an annual review might be sufficient. However, for industries experiencing rapid changes in material costs, labor, or market demand, quarterly or even monthly reviews are advisable. Any significant change in your cost structure or pricing strategy absolutely warrants an immediate recalculation.
Can a break-even analysis help with pricing decisions?
Absolutely. By understanding your contribution margin per unit and how it relates to your fixed costs, you can directly inform pricing. If your current price yields a contribution margin too low to cover fixed costs at a realistic sales volume, you know you need to increase prices or find ways to reduce variable costs. Conversely, if your contribution margin is very high, you might have room to offer discounts or promotions to drive sales volume without jeopardizing profitability.
What is the difference between break-even and target profit analysis?
A break-even analysis determines the sales volume needed to achieve zero profit. A target profit analysis, on the other hand, calculates the sales volume required to achieve a specific profit goal. The formula is similar but includes the desired profit in the numerator: (Fixed Costs + Target Profit) / Contribution Margin Per Unit. You can find templates that integrate both analyses.