Free Excel startup financial model: build yours fast
Get a free startup financial model template in Excel to project your business finances and understand cash runway.
By the end of this, you'll have a working, multi-year financial model in Excel that projects your startup's income statement, balance sheet, and cash flow statement, all driven by a robust set of assumptions. You can then use this to understand your cash runway, model different growth scenarios, and present a clear financial picture to potential investors. Finding a good startup financial model template Excel free can be the first major step in getting your finances organized, especially when you're just starting out and every dollar counts.
The core of any financial model is its assumption sheet. This is where you input all the variables that drive your projections. Think of it as the engine room. If your assumptions are solid, your projections will be far more reliable. For a startup, these assumptions typically fall into several categories: revenue drivers, cost of goods sold (COGS), operating expenses, capital expenditures, and financing.
Setting Up Your Assumption Sheet
You'll want a dedicated sheet, often named "Assumptions" or "Inputs." Start by listing out each key driver. For revenue, this might include:
- Average Revenue Per User (ARPU): If you're a SaaS business.
- Customer Acquisition Cost (CAC): How much it costs to get a new customer.
- Churn Rate: The percentage of customers you lose each period.
- Conversion Rate: From lead to paying customer.
- Average Order Value (AOV): For e-commerce or product-based businesses.
- Sales Volume: Number of units sold.
For costs, break them down. Cost of Goods Sold (COGS) is crucial for businesses selling physical products or services with direct material/labor costs. This could include raw materials, direct labor, and manufacturing overhead. For software or service businesses, COGS might be lower, but you'll have significant Operating Expenses (OpEx).
Key Operating Expense Categories
Operating expenses cover everything else needed to run the business. It's vital to be granular here. Common categories include:
- Salaries & Wages: Include base pay, benefits, and payroll taxes for all employees.
- Marketing & Sales: Advertising, commissions, software subscriptions for sales tools.
- Rent & Utilities: Office space, electricity, internet.
- Software & Subscriptions: CRM, accounting software, project management tools.
- Professional Services: Legal fees, accounting services, consulting.
- Travel & Entertainment: Business trips, client meetings.
When building your template, it’s often best to have these line items clearly defined. You might have a sub-category for each major expense type. For instance, under "Salaries & Wages," you could list "Founder Salaries," "Engineering Salaries," "Sales Team Salaries," and "Marketing Team Salaries." This level of detail helps in tracking and understanding where your money is going.
Projecting Revenue Growth
Revenue projection is often the most dynamic part of a startup model. You need to forecast how many customers you'll acquire and how much revenue each will generate over time. A common approach is to build a "bottom-up" forecast. This starts with your sales and marketing efforts.
For example, assume you’re planning to run online ad campaigns. You might estimate:
- 01Ad Spend: $5,000 per month.
- 02Click-Through Rate (CTR): 2%.
- 03Cost Per Click (CPC): $1.00.
- 04Website Visitors: (Ad Spend / CPC) = 5,000 visitors per month.
- 05Conversion Rate (Visitor to Lead): 10%.
- 06Leads Generated: 5,000 visitors * 10% = 500 leads per month.
- 07Conversion Rate (Lead to Customer): 5%.
- 08New Customers Acquired: 500 leads * 5% = 25 new customers per month.
- 09Average Revenue Per Customer (ARPC): $100 per month.
- 10Monthly Recurring Revenue (MRR): 25 customers * $100 = $2,500.
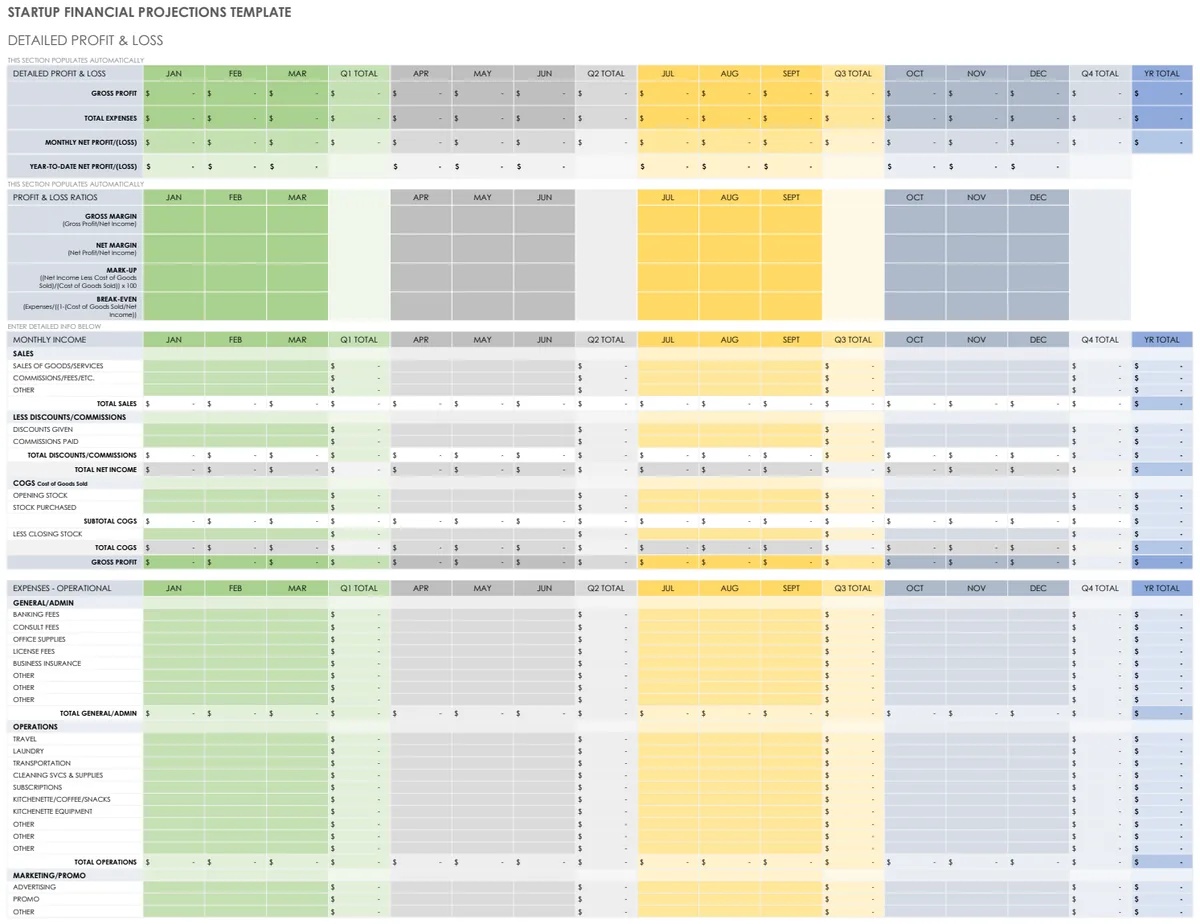
You would then project this out month by month, factoring in churn and potentially increasing ARPC or customer acquisition as you scale. This detailed approach provides a much more grounded revenue forecast than simply picking a growth percentage out of thin air. If you need a comprehensive model that handles this complexity, consider the Startup Financial Projections Template.
Understanding Cash Flow Dynamics
Cash flow is king for startups. Profitability on paper doesn't mean you have cash to pay the bills. Your cash flow statement tracks the actual movement of money in and out of your business.
The three main sections are:
- 01Cash Flow from Operations: This starts with net income and adjusts for non-cash items (like depreciation) and changes in working capital (like accounts receivable, accounts payable, and inventory).
- 02Cash Flow from Investing: This includes purchases and sales of long-term assets, such as equipment or property. For many early-stage startups, this might be minimal unless significant equipment is being bought.
- 03Cash Flow from Financing: This covers debt, equity financing, and dividend payments. For a startup, this is often where initial funding rounds and loan draws appear.
A crucial metric here is your Cash Runway, which is the amount of cash you have divided by your average monthly burn rate (net cash outflow). This tells you how many months you can operate before running out of money. A well-built financial model will clearly display your projected cash balance and burn rate.
Capital Expenditures and Depreciation
Capital expenditures (CapEx) are investments in long-term assets that provide future economic benefit. This could be purchasing servers, office furniture, or developing proprietary software. These costs aren't expensed immediately on the income statement; instead, they are capitalized on the balance sheet and then expensed over time through depreciation.
Depreciation is an accounting method to allocate the cost of a tangible asset over its useful life. For instance, if you buy a $10,000 piece of equipment with a 5-year useful life, you might depreciate it using the straight-line method, recording $2,000 in depreciation expense each year ($10,000 / 5 years). This depreciation expense reduces your taxable income (and thus your taxes) and your net income on the P&L, but it's a non-cash expense, so it’s added back on the cash flow statement.
Key Mistakes to Avoid
Many startups make common errors when building their financial models.
- Unrealistic Revenue Growth: Assuming hyper-growth without a clear plan to achieve it.
- Underestimating Expenses: Not accounting for all operating costs, especially salaries, marketing, and overhead.
- Ignoring Working Capital: Failing to model accounts receivable (money owed to you) and accounts payable (money you owe others), which significantly impacts cash flow.
- Not Modeling Churn: Especially for subscription businesses, not accounting for customer attrition leads to inflated revenue projections.
- Overly Complex Models: Trying to account for every single minor variable can make the model unwieldy and hard to update. Focus on the key drivers.
If your focus is on projecting startup costs and revenue forecasts to validate your business model, the Startup Expense and Revenue Projection Template can be a great starting point before building out a full 3-statement model.
Linking Your Sheets for Automation
The real power of a financial model comes from linking your sheets. Your "Assumptions" sheet feeds into your "Income Statement," "Balance Sheet," and "Cash Flow Statement." Changes in assumptions should automatically update all downstream reports.
For example, on your "Income Statement" sheet, your "Revenue" line item might be a formula like: =Assumptions!B5 * Assumptions!B6 * Assumptions!B7 (representing ARPU * New Customers * Months).
Your "Cost of Goods Sold" might be: =Assumptions!C5 * Assumptions!B5 * Assumptions!B6 * Assumptions!B7 (representing COGS % * ARPU * New Customers * Months).
The "Balance Sheet" will link to the Income Statement for Net Income, and to the Cash Flow Statement for changes in cash. The Capital Expenditures from your assumptions sheet will feed into the "Property, Plant, and Equipment" line item on the Balance Sheet, and depreciation will flow through the Income Statement and Cash Flow Statement.
Building the Income Statement
The Income Statement (also known as the Profit and Loss or P&L) summarizes your revenues, expenses, and profits over a specific period (monthly, quarterly, annually). It typically follows this structure: Revenue
- Cost of Goods Sold (COGS)
= Gross Profit
- Operating Expenses (Salaries, Marketing, Rent, etc.)
= Operating Income (EBIT)
- Interest Expense
- Taxes
= Net Income
Constructing the Balance Sheet
The Balance Sheet presents a snapshot of your company's assets, liabilities, and equity at a specific point in time. It adheres to the fundamental accounting equation: Assets = Liabilities + Equity.
- Assets: What the company owns (Cash, Accounts Receivable, Inventory, Equipment).
- Liabilities: What the company owes to others (Accounts Payable, Loans).
- Equity: The owners' stake in the company (Common Stock, Retained Earnings).
Generating the Cash Flow Statement
As discussed, this statement details the cash generated and used by your operations, investments, and financing activities. It reconciles the beginning cash balance to the ending cash balance.
Using Your Model for Decision Making
Once built, your financial model isn't just a static document; it's a dynamic tool. You can run "what-if" scenarios by changing key assumptions.
- What happens if our CAC increases by 20%?
- What if our conversion rate is only 3% instead of 5%?
- What if we raise an additional $500,000 in funding?
This allows you to stress-test your business plan and understand the potential impact of various factors on your financial health. This kind of detailed forecasting is essential for securing funding or planning for growth. A robust model can even integrate valuation methods, such as in the Financial Projection Model with DCF Valuation, which goes beyond basic projections to estimate your company's worth.
What is a good starting point for monthly revenue projections?
For a truly free template, you can start with a simple projection: estimate your average customer value and then project how many customers you can realistically acquire each month based on your sales and marketing capacity. For example, if your average customer pays $50/month and you believe you can acquire 10 new customers in month 1, 20 in month 2, and so on, that's your baseline. Always be conservative.
How do I handle variable costs like marketing spend?
Variable costs are those that fluctuate with sales volume. For marketing, you might tie it directly to your customer acquisition plan. If your plan is to spend $10 on ads to acquire one customer, then your ad spend for the month will be 10 times the number of new customers you acquire. Alternatively, you can set a fixed monthly budget and then calculate the CAC based on the results.
Should I include detailed employee salaries or a lump sum?
It's generally better to be detailed for salaries, at least for the core team. List out each role (e.g., CEO, Head of Engineering, Sales Rep) and their estimated annual salary. Then, break that down monthly. This helps in understanding your burn rate more accurately. For less critical roles or future hires, you can use placeholder "headcount" numbers and average salaries.
What if I need a more advanced model for corporate planning?
While many startup templates are lean, some businesses, particularly as they grow or if they are part of a larger corporate structure, require more complex models. Templates like the PwC Financial Model Template are designed for more intricate corporate financial planning, including detailed reconciliation checks and multi-sheet architecture for complex assumptions. Our library offers a range of templates, and you can access all of them with a one-time payment of $9.