Your free Excel inventory tracker: build it fast
Discover how to build a fast, dynamic Excel inventory tracker that goes beyond a static list to manage your stock effectively.
The most common failure of a free inventory management template in Excel is that it quickly becomes a static list, not a dynamic system. This happens because it lacks automated reorder points and clear visibility into stock velocity. Without these, you're essentially guessing when to buy more.
If you're searching for an inventory management template Excel free, you're likely trying to get a handle on your stock levels, avoid costly overstocking, and ensure you never miss a sale due to an empty shelf. A well-structured template is crucial for small businesses, e-commerce sellers, or even personal collections, providing a clear overview of what you have, where it is, and its value. But a simple list won't cut it long-term.
Why Simple Spreadsheets Fail
Many people start with a basic Excel sheet, listing item names, quantities, and maybe a purchase price. This approach works fine for a handful of items. However, as your inventory grows, this method becomes unwieldy.
- Lack of Automation: Manually updating quantities after every sale or restock is prone to errors and incredibly time-consuming.
- No Reorder Alerts: You can't easily see which items are running low without manually scanning the entire list. This leads to stockouts.
- Difficulty Tracking Costs: Understanding your total inventory value or cost of goods sold (COGS) becomes a manual calculation nightmare.
- Poor Visibility: Identifying slow-moving vs. fast-moving items is nearly impossible, hindering informed purchasing decisions.
A truly useful inventory system needs to do more than just list items. It needs to help you manage stock proactively.
Building a Better Inventory System in Excel
To move beyond a static list and towards a functional inventory management system, you need to incorporate a few key elements. These aren't overly complex but require thoughtful setup.
Essential Columns for Your Template
Start with a robust set of columns in your main inventory sheet. Think about what information you need to make decisions.
- SKU (Stock Keeping Unit): A unique identifier for each product variation. Crucial for accuracy.
- Product Name: A clear, descriptive name.
- Category: Grouping similar items (e.g., "T-shirts," "Mugs," "Electronics").
- Supplier: Who you buy from.
- Cost Per Unit: The price you pay for one item.
- Current Stock: The number of units you currently have on hand.
- Reorder Point: The minimum stock level that triggers a reorder. This is critical.
- Max Stock Level: The ideal maximum quantity to have on hand, preventing overstocking.
- Unit Price (Selling Price): What you sell the item for.
- Total Stock Value (Cost): Calculated as
Current Stock * Cost Per Unit. - Total Stock Value (Retail): Calculated as
Current Stock * Unit Price. - Date Last Stocked: When you last received this item.
- Sales Velocity (Optional but Recommended): How quickly items are selling. This requires a separate tracking mechanism.
Implementing Reorder Points
This is where a free inventory management template Excel can really start to shine. Setting a reorder point means you don't have to constantly monitor stock levels manually.
- 01Define the Reorder Point: For each item, determine the minimum quantity you can afford to have before you need to order more. This is often based on lead time (how long it takes to get more stock) and average sales per day. For example, if an item sells 5 units a day and it takes 3 days to restock, your reorder point might be 15 units.
- 02Calculate Current Stock: This is your
Current Stockcolumn. - 03Use Conditional Formatting: This is the visual cue you need.
- Select your
Current Stockcolumn (e.g., Column G). - Go to the "Home" tab in Excel.
- Click "Conditional Formatting" -> "New Rule."
- Choose "Use a formula to determine which cells to format."
- Enter a formula like
=G2<H2(assuming G isCurrent Stockand H isReorder Point, and you are applying this to row 2). - Click "Format" and choose a fill color (e.g., light red) or font color to highlight cells where stock is at or below the reorder point.
- Apply this rule to the entire
Current Stockrange.
Now, any time your Current Stock drops to or below your Reorder Point, that cell will automatically highlight, signaling it's time to reorder.
Calculating Inventory Value
Knowing the total value of your inventory is vital for accounting and financial planning.
- Total Inventory Cost: To calculate the total value of all inventory based on your purchase cost, you can use a simple sum formula. If your
Total Stock Value (Cost)is in column J (fromCurrent Stock * Cost Per Unit), you'd add a formula at the bottom of that column:=SUM(J:J). - Total Inventory Retail Value: Similarly, if your
Total Stock Value (Retail)is in column K, use=SUM(K:K).
This gives you an immediate snapshot of your investment in inventory.
Automating with Formulas
Beyond conditional formatting, Excel's built-in formulas are your best friend.
SUMIFS for Categorized Value
If you want to know the total value of inventory within a specific category, SUMIFS is excellent.
Let's say:
Categoryis in Column C.Total Stock Value (Cost)is in Column J.
To find the total cost value for items in the "Electronics" category, you'd use: =SUMIFS(J:J, C:C, "Electronics")
This formula sums values in Column J only for rows where Column C contains "Electronics."
COUNTIFS for Stock Status
You can also use COUNTIFS to quickly see how many items are below their reorder point.
Current Stockis in Column G.Reorder Pointis in Column H.
To count items where Current Stock is less than Reorder Point: =COUNTIFS(G:G, "<"&H:H)
This will give you a number, e.g., "5 items need reordering."
Leveraging Templates for Speed
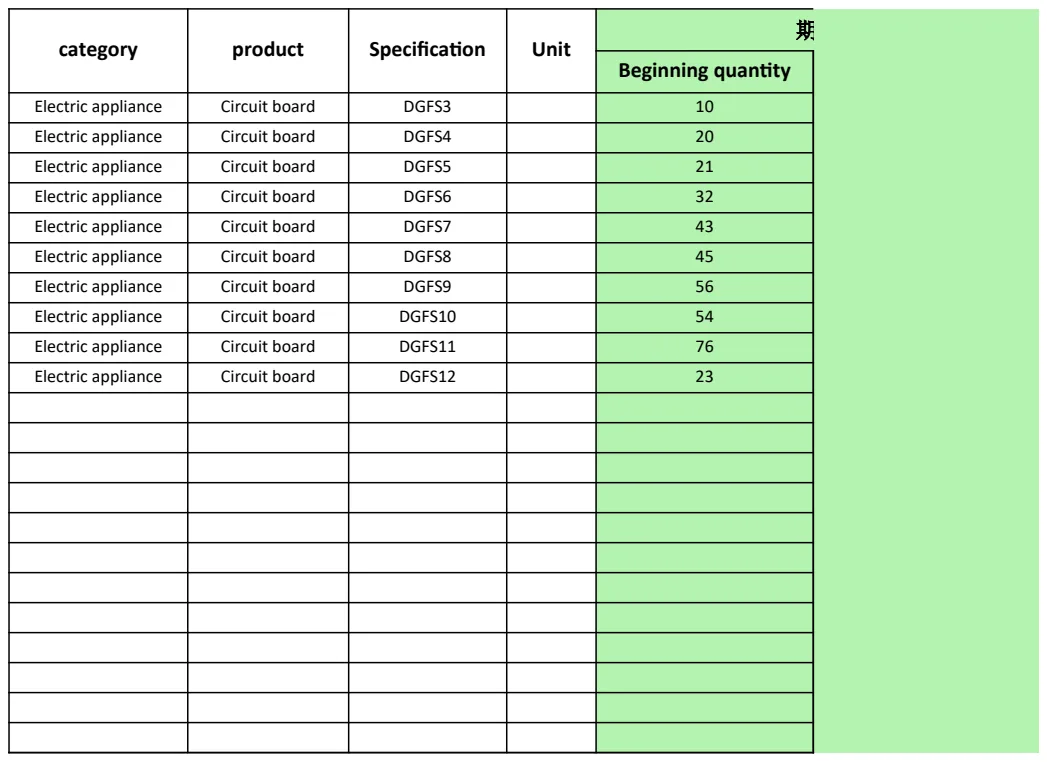
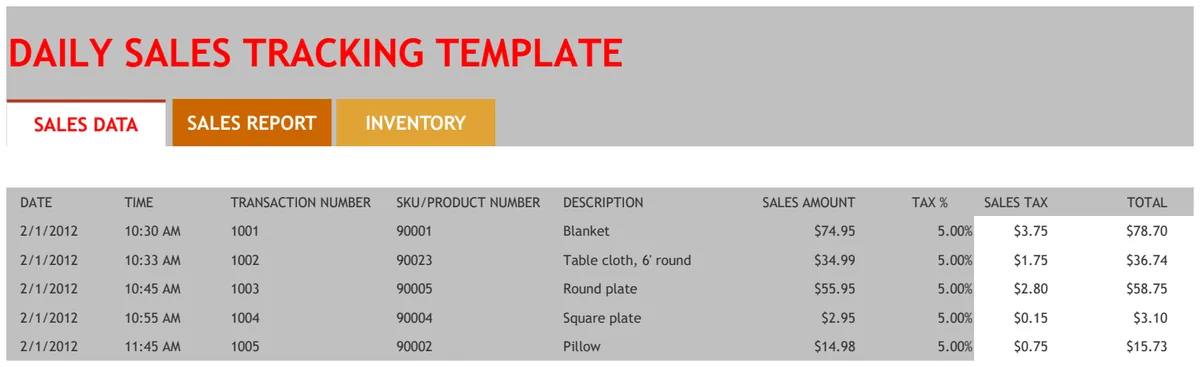
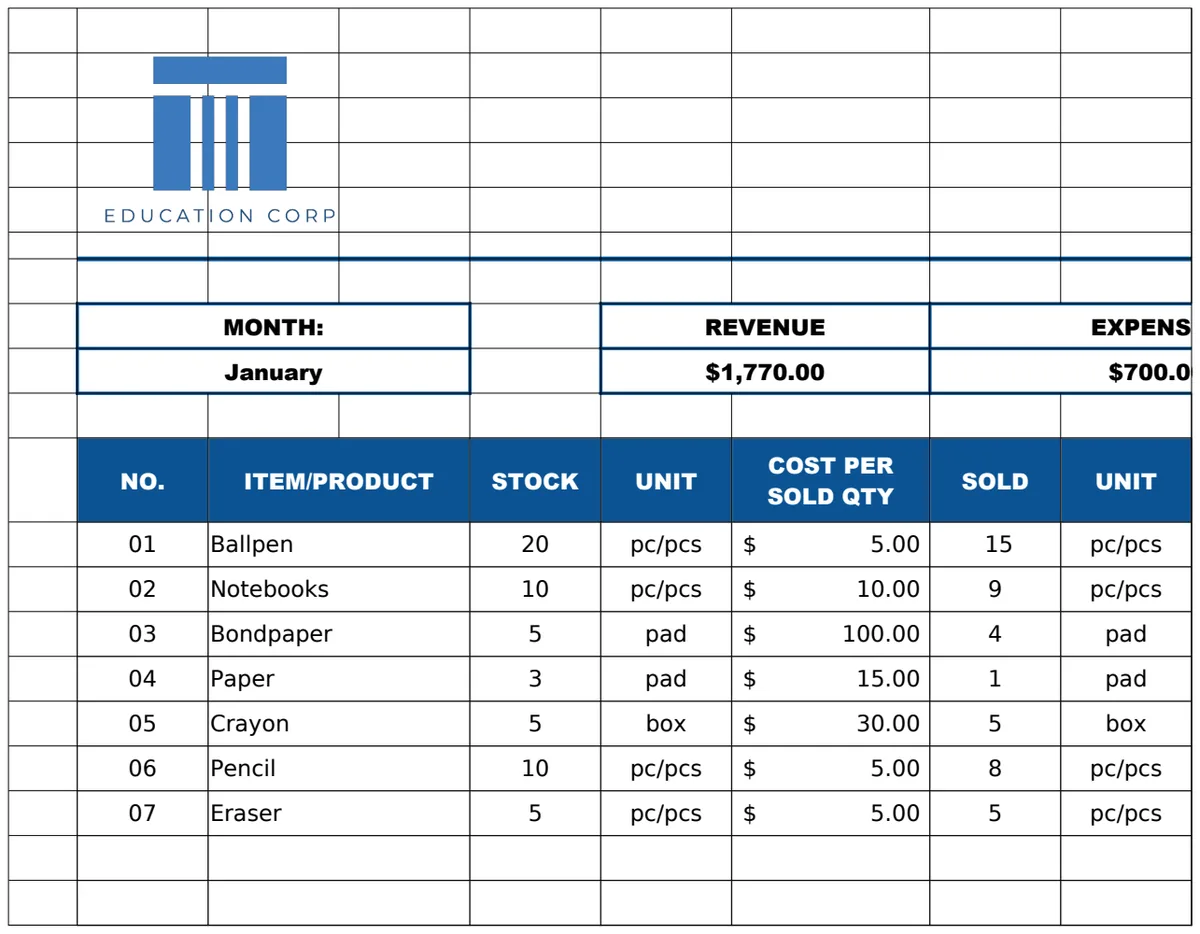
While you can build a powerful system from scratch, using a pre-built template can save significant time and effort, especially if you're just starting. A good inventory management template Excel free download can provide a solid foundation.
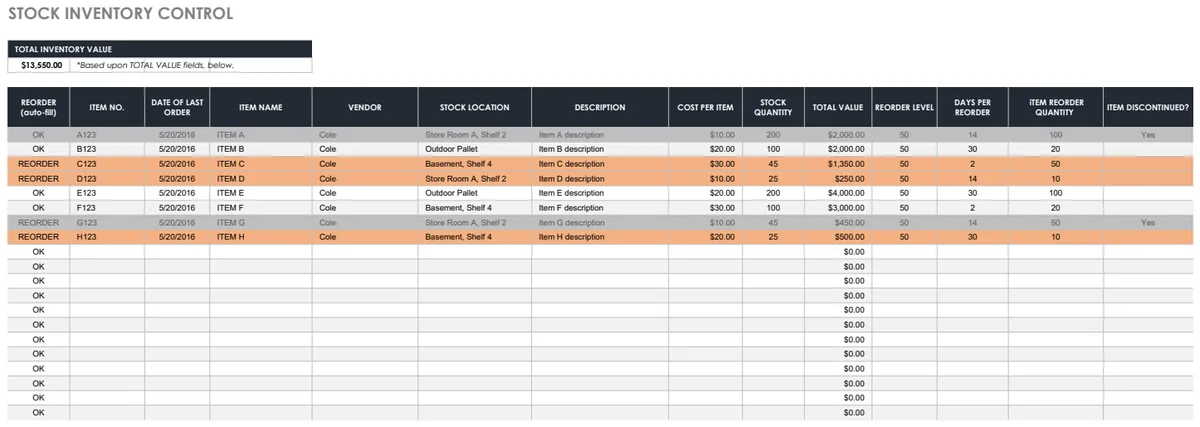
For instance, the Stock Inventory Control template is designed to automate stock tracking, manage vendor information, and provide clear visibility into your inventory levels. It often includes pre-configured formulas and conditional formatting that you can adapt.
If your primary concern is understanding the cost implications of your stock, a template like the Inventory Cost Template can be invaluable. It helps you track not just quantities but also the precise unit costs and calculates your overall inventory valuation automatically, often with visual charts to make the data easier to digest.
Common Mistakes to Avoid
Even with a good template, errors can creep in. Being aware of these common pitfalls can save you a lot of headaches.
- Inconsistent SKUs: Using different SKUs for the same product or variations of a product (e.g., "RED-SHIRT-L" vs. "RED-SHIRT-LARGE") will break your tracking. Standardize your SKU naming convention.
- Not Updating Immediately: The biggest error is delaying updates. Every sale, return, or restock should be logged as soon as possible. Batching updates leads to inaccuracies.
- Ignoring Slow-Moving Stock: You might have a lot of an item, but if it hasn't sold in six months, it's tying up capital. Regularly review your stock velocity.
- Forgetting "Ghost" Inventory: Items returned by customers that aren't properly processed back into stock or items lost in transit can create discrepancies.
- Over-Reliance on a Single Column: Trying to manage everything in one cell or a very basic list will quickly lead to chaos. Use separate, well-defined columns for distinct pieces of information.
Frequently Asked Questions
How do I track sales in my inventory sheet?
You generally don't track sales directly in your main inventory sheet. Instead, you'll have a separate "Sales Log" or "Transactions" sheet. Each time a sale occurs, you record the SKU, quantity sold, and date. Then, you use formulas (like SUMIFS or VLOOKUP/XLOOKUP) to subtract the total quantity sold from your Current Stock on the main inventory sheet, or use that sales data to calculate sales velocity.
Can I track multiple warehouses or locations?
Yes, you can adapt your template. Add a "Location" or "Warehouse" column to your inventory sheet. Then, you can use SUMIFS or COUNTIFS to filter by location. For example, =SUMIFS(J:J, C:C, "Electronics", L:L, "Warehouse A") would sum the value of electronics in "Warehouse A."
What if I sell products in bundles?
Bundles require a slightly more advanced setup. You'll likely need a separate "Bill of Materials" or "Bundle Contents" sheet that lists which individual SKUs make up each bundle and in what quantities. When a bundle is sold, your system needs to deduct the component items from their respective stock counts. Alternatively, you can create a unique SKU for each bundle and manage its stock separately, but this doesn't account for the depletion of individual component parts.